# Introduction
Outcomes Driven AIOps
CloudFabrix AIOps solution is called the Ops Intelligence & Analytics (cfxOIA). This solution provides domain-agnostic AIOps capabilities to bring algorithmic decisions to IT operations from several disparate monitoring and other operational data sources. cfxOIA or OIA is a software solution that runs as a distributed application using microservices and containers architecture. OIA is available as an enterprise offering, for on-premise or cloud deployment. OIA can also be offered as fully managed SaaS by CloudFabrix or its partners.

# How it Works
Basic Concepts, Technical Overview and How it Works
## **How it Works**
cfxOIA works by ingesting IT operational data, like alerts, events, and traces from multiple performance monitoring tools, logs, and log-based alerts from log monitoring tools and observational data from data-lakes for performing algorithmic correlation of alerts to reduce noise. OIA normalizes every alert with enrichment data established by stitching CMDB data, service mappings, and asset management data together to derive context-rich data for every alert that is ingested into the platform.
cfxOIA then correlates alerts, based on enriched data. Identifying correlation patterns is done on OIA's machine learning engine to identify symptomatic patterns in alert data. These patterns are then provided as recommendations to AIOps administrators to consider grouping or deduplication of future alerts that match those symptoms. Admins can create additional correlation policies to tune algorithmic correlation behavior to group alerts across on the entire application stack, within a time window, or in an infrastructure layer.

cfxOIA has an out-of-box implementation to correlate well-known operational issues related to alert burst scenarios, alert flapping situations, and transient alerts. This robust correlation engine allows the admin to implement event correlation for any type of situation, where the majority of patterns are detected with an unsupervised machine learning combined with additional flexibility for admin configurable policies to tune correlation behavior. Alerts that are correlated are called Alert Groups and the policies are called Correlation Policies. Learn More about [Alert Correlation here.](https://oiadocs.cloudfabrix.io/features-guide/alert-correlation/alert-correlation)
Deduplicated and correlated alerts are grouped in an Alert Group that indicates an active operational issue or an OIA Incident. Every Alert Group has one OIA Incident, which is sent to the ITSM systems (like ServiceNow, PagerDuty, etc,.) and to OIA Incident Room for further Incident processing.

Incident Room is a dynamic and incident-centric workbench that provides all the triage data, Operational metrics, KPIs, Logs, Impacted assets context, Collaboration, and Diagnostic tools all at one place, so that operators can swiftly perform incident root cause analysis and service restoration. This helps in reducing Incident MTTR.
## Install & configure
For on-premise deployments, OIA is offered as a packaged application that is available for deployment on VMware vCenter 6.x or above. (OVF Image). The packaged application comprises of CentOS as the base operating system along with the required OS packages and 3rd party software modules. In large enterprise environments (restricted environments), where the customer prefers to install OIA on a custom Linux version (for example - RHEL 7.x), it is possible to bring up OIA on existing Virtual Machines.
## Data Ingestion & Integrations
OIA operates on IT operational data like alerts, events, traces, metrics, most of which are generated by monitoring tools and in some cases replicated in an aggregate data-lake. OIA supports integrations with many featured vendors using Webhooks, APIs, Kafka messages, etc. Custom integrations can be developed and supported by CloudFabrix professional services, Partners, using CloudFabrix Provided Developer SDKs.
Learn more about [Integrations](/integrations-guide/integrations-overview)
## Data Analysis and Stitching
Large enterprise environments have a mix of structured and unstructured IT data sources and many custom IT data parameters defined and implemented across various data sources. For example, IT environments can implement custom attributes like machine type, environment, site code, department name, support group, application ID, etc. Not every tool implements these attributes, making it difficult to understand which operational data sources are relevant for AIOps implementation and which attributes can be gleaned from which sources to enrich raw alert data. This is where the OIA Data Analysis and Stitching module comes into the picture to help establish
* Asset Identities
* Enrichment Attributes
* Enrichment Flows
* Baseline Analysis
This module works off of historical alert/event data, Ticket data, CMDB data, Service mappings, Asset management and establishes a data chain that will help in appropriate data source selection and enrichment attributes selection for AIOps implementation.
## Alert Enrichment
Raw alert data contains extremely limited information, often consisting of id, severity, message/description, rule name, and asset IP/hostname, etc. This information doesn't provide enough service context (Application or Service name, Environment, machine-type, etc.) or supportability context (NOC id, Site-id, Department, Support-group, etc.) which are essential data for efficient correlation of alerts. OIA performs automated alert data enrichment using a combination of following approaches
* Enrichment with stacks and asset context established through Data Analysis & Stitching module
* Enrichment with stacks and asset context that is dynamically discovered/resolved for elastic environments
Learn more about [Alert Enrichment](/features-guide/alert-correlation/alert-enrichment)
## Alert Correlation
Alerts and events, in general, have a varying schema, but in OIA they are all normalized and standardized to an extensive model (with more than 30+ attributes). Related alerts are deduplicated and correlated to form Alert Groups. OIA's correlation engine provides recommendations for detecting and grouping new alert patterns. Admins can grasp, analyze the recommendations, and convert into Correlation Policies or define new policies altogether. Admins can also implement alert Suppression Policies to suppress alerts that escape during maintenance windows. OIA provides out of box policies to treat well-known operational issues like alert burst scenarios, flapping scenarios, etc.
Learn more about [Alert Correlation](/features-guide/alert-correlation/alert-correlation)
## Incident Management
OIA creates Incident for every Alert Group and sends them to ITSM tools (ServiceNow, PagerDuty, etc.) for further processing by IT Analysts, NOC Engineers, or Tier-1/Tier-2 Engineers. OIA provides a module called Incident Room that AIOps operators and ITSM operators can use to accelerate incident analysis, resolution. The Incident room provides all the relevant context, Data, Insights, and Tools at one place for incident resolution.
Learn more about [Incident Management](/features-guide/incidents)
## ML Driven Operations
OIA uses machine learning (ML) at its core to intelligently learn patterns from huge volumes of historical as well as streaming data and automate key IT operational activities and decisions at large scale.
**Key ML driven Operations include**
* Alert Correlation (uses unsupervised ML)
* Log Clustering and Heatmap
* Alert volume Seasonality *(can be run per app, source system, severity etc.)*
* Alert volume Anomaly Detection *(can be run per app, source system, severity etc.)*
* Alert volume Prediction *(can be run per app, source system, severity etc.)*
* Incident triage data Anomaly Detection and Noticeable Changes
* Similar incidents
Prediction insight consists of forecasting alert volume or ingestion rate, providing a perspective into how many alerts Ops team can expect in future. OIA can perform this prediction analysis on multiple dimensions, including alerts coming a certain source, or alerts of certain application, severity, site or even alerts of certain symptom. In addition to prediction insights, OIA also provides seasonality and anomaly detection when ML jobs are run, which can be executed on-demand or scheduled to be run periodically, which helps in continous learning, training and testing of models.
OIA currently supports 3 ML pipelines out of the box, Clustering, Classification and Regression. ML jobs allow hyper parameter tuning by making selections from UI itself. Advanced customization scenarios allow uploading of new ML pipelines.
Learn more about [ML Driven Operations](/features-guide/ml-driven-operations)
## Analytics
OIA provides key analytics to track AIOps related KPIs like noise reduction efficiency, Alert ingestion trends, Most chatty alert types, etc.
OIA has a unique data exploration feature called Quick Insights that provides an at-a-glance visual clue of distribution and other characteristics of data. Quick Insights on Incidents provide visual cues about the distribution of Incidents based on priority, Support-group, Incident-age, Environment, Application, Department, etc. Similarly, Quick Insights provide visual cues about the distribution of alerts across severity, Source, Application, Machine type, Environment, etc.
Learn more about [Analytics](/features-guide/analytics)
## UI Features
OIA provides a web-based portal that is accessible via a standard browser and uses HTML 5 to render User Interface (UI). There is no need to install any thick client to access the OIA web-portal. OIA portal provides certain advanced UI features for efficient data handling and customization.
**Filters:** Allow efficient filtering, Saving, and Reusing filters. Table View Customization
Learn more about [Filters Management](/ui-and-portal-features-guide/filters)
**Customize Columns:** Displayed in the table, Change the order of columns.
Learn more about [Customizing Table Views](/ui-and-portal-features-guide/customizing-table-views)
**Exporting Data**: Exporting data like Incidents, Alerts, etc.
Learn more about [Exporting Data](/ui-and-portal-features-guide/exporting-data)
# Getting Started
### Logging in
Enter cfxDimensions URL provided by your administrator, enter username and password. Click Login.

### Forgotten password
If you have forgotten your password, you can reset it by performing the following steps,
1. On the log-in page, click the *Forgot Password?* (Link)
2. Enter your username
3. Click *START PASSWORD RECOVERY*.
4. You will receive an email with a link to reset your password. Click the link that you have received on your email and reset your password.

### Change Password

After logging into cfxDimensions, click at the top-left hamburger menu (1) as shown above, click on the downward arrow next to user id (2), choose 'User Profile' (3) from displayed pop-up view. Click on Change Password (4) to display the '*Change Password*' screen. Enter old and new passwords (5) and click on 'Update' (6). Using the above-explained steps, you can update your password (user password).
### Logging out
On the top right corner of every page on the OIA application, you can click on 3 little vertical dots (hamburger menu) and click on the icon to show the menu. Click on Logout.

### Change User Profile
To update contact number or to change user first, middle or last name, click on '*Update*' as shown below.

From the main left top menu (1), select drop-down on the user (2), select User Profile (3), click on Update (4) and then update the values (5). Click 'Update' (6) to save the values.
### Applications
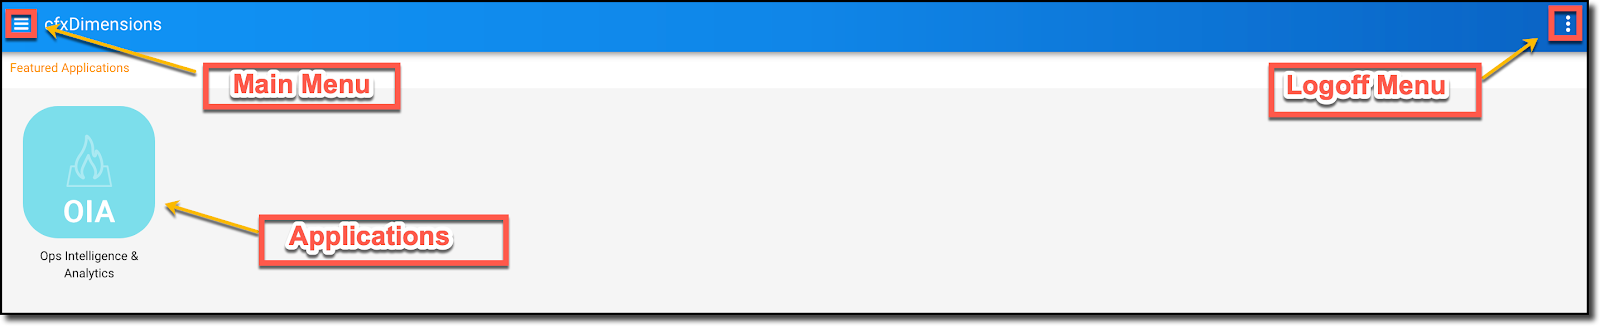
CloudFabrix provides major functionality like cfxAIA, cfxOIA, cfxGenie as applications. Once the user logs into the platform, the home page displays 'Featured Applications' and shows the corresponding application(s) relevant to the logged-in user.
The OIA User homepage for cfxOIA application is as shown below:
The following screen capture displays 'Project Admin' Main Page.

Main Menu - From any view of the cfxOIA application, users can navigate to the 'Featured Applications' page by clicking on Main Menu selection (as shown above) and Selecting 'Featured Applications' action button.
### Various Menu / Toolbar on a Page
The following image displays various Toolbar / Menus on a project page.

### Projects
By clicking on the 'Ops intelligence & Analytics (OIA)' application icon (main landing page for a user), the user can navigate to the 'Projects page' (as shown below in Sample Project screen capture).
{% hint style="info" %}
Project Administrators will be able to configure Projects. For more information on how to configure Project, please click [here](/admin-features-guide/projects).
{% endhint %}
\
A user can have one or more projects assigned. Click on 'Open' on the selected project to open the project.

Once a 'Project' is selected via the 'Open' button, then the user can navigate to [Incidents](/features-guide/incidents/incidents-overview)/[Alerts ](/features-guide/alert-watch)home screen as shown.

# Glossary
Terminology used in CloudFabrix AIOps Solution
| Term | Description |
| ------------------- | --------------------------------------------------------------------------------------------------------------------- |
| Alert Group | Grouping of related or redundant alerts based on a correlation policy |
| Correlation Policy | The Policy defines how to correlate alerts to create an Alert Groups |
| Suppression Policy | The Policy that defines how to suppress alerts (ex: alerts that escape maintenance windows) |
| Incident | An actionable incident that is created from an Alert Group. |
| Stack of Full-Stack | A service or application and associated components across all underlying layers (eg: app & infra components together) |
| Alert Watch | A module that provides visibility, controls, and alerts on alert noise reduction |
| Incident Room | A module that provides visibility, controls, and actions to root cause for faster incident resolution |
| MTTR | Mean Time To Resolve |
| MTTD | Mean Time To Detect |
| MTTI | Mean Time To Identify |
| | |
# cfxDimensions Installation
The following guide provides instructions to help you with the installation of the cfxDimensions platform.
The cfxDimensions consists of the following Virtual machines (VMs).
**1.Platform VM** - The platform VM will host two sets of core services required for cfxDimensions.
***a) Infra Services***: Database, Object Storage, Message Queue, Application server, Search engine, etc.
***b) Platform Services***: Service Registry, Notification, Identity Service, Service Provisioner, etc.
**2. Service VM** - Service VMs will host application services ( e.g. cfxOIA, cfxAIA, etc.).
**3. cLambda VM** - cLambda VM will host pre-launched containers for running cLambda jobs (that are needed dynamically for performing various activities. Example, executing a command, collecting data, jobs etc).
**4. cfxCollector VM (Optional)** - This VM will host Gateway and Protowraps to perform discovery and inventory-related operations using various protocols (ICMP, SNMP, Syslog, SSH, RestAPI, APIs, TFTP, Discovery gateway, SNMPTrap, etc).
{% content-ref url="/pages/-MCpHkFWK6esHsNrcb80" %}
[Hardware and Software](/implementer-guide/platform-installation/hardware-and-software)
{% endcontent-ref %}
{% content-ref url="/pages/-MCpKYhPBWfiaxsFXxeH" %}
[cfxDimenions on VMware vSphere](/implementer-guide/platform-installation/cfxdimenions-on-vmware-vsphere)
{% endcontent-ref %}
{% content-ref url="/pages/-MCp\_GSrYV\_jrFUKm-Mi" %}
[cfxDimensions Setup & Install](/implementer-guide/platform-installation/cfxdimensions-setup-and-install)
{% endcontent-ref %}
# Hardware and Software
### Hardware Requirements:
| **Purpose** | **Memory / CPU / Storage (HW)** | **Details** |
| ------------ | ------------------------------------------------------------------------------- | ---------------------------------------------------------------------------------------------------------------------------------------------------------------------------------- |
| Platform VM | Memory – 32 GB
CPU – 8 vCPU
Storage – See OVF guidelines
| OVF Guidelines
SSD based storage is preferred.
/opt – 100G
/kafka-logs1 – 100G
/kafka-logs2 – 100G
/zookeeper – 20G
Docker Disk – 100G
|
| Service VM | Memory – 16 GB
CPU – 4 vCPU
Storage – See OVF guidelines
| /opt – 50G
Docker Disk – 100G
|
| cLambda VM | Memory – 16 GB
CPU – 4 vCPU
Storage – as per OVF guidelines
| For running cLambda jobs |
| cfxCollector | Memory – 16GB
CPU – 4 vCPU
Storage – as per OVF guidelines
| /opt – 50G
Docker Disk – 100G
|
| | | |
Note: For minimal cfxDimensions platform deployment, 1 Platform VM, 1 Service VM, 1 cLambda VM is recommended. For production deployments, reach out to
### **Supported Virtual Infrastructure Platforms:**
* VMware vCenter 6.0 or above & vSphere 6.0 or above
* AWS EC2
### **Additional Requirements:**
| **Purpose** | **Details** |
| ---------------------------------------------------------------------- | ---------------------------------------------------------------------------------------------------------------------------------------------------------------------------------------------------------------------------------------------------------------------------------------------------------------------------------------------------------------------------------------------------------- |
| External Public CA Certificate | Requires external certificate in PEM format for the load balancer |
| Ports programming for DMZ/LAN Access | - Load Balancer in DMZ should be able to reach ports 8080 in Internal Network
|
| Port forwarding on the firewall to load balancer, Gateway Communicator | - The Platform needs to be in the DMZ network with bi-directional network connectivity.
- Firewall ports 443 need to be opened up for public virtual IP/DNS on the firewall/gateway
|
| NFS Shared Storage (Optional) | Need NFS Shared storage for the below tasks
- Platform Configuration
- Service Logs/Data
- Backup
Need 3 Different Mount Points
- Platform Mount Point
- Service/Tenant Mount Point
- Backup mount point
Note: Platform VM acts as NFS server to provide above mount points (by default). External NFS storage also is supported.
|
| Outbound Network Access | registry.cloudfabrix.io:443 |
| Macaw Tool | |
| Python outbound access | |
# cfxDimenions on VMware vSphere
This section provides information on how to provision VMs for the cfxDimensions platform in VMware vCenter (6.5 to 6.7 or above) environment.
cfxDimensions platform OVF comes with below configuration profiles.
* Platform Instance
* Service Instance
* cLambda Instance
* Platform HA Instance
* Platform POC Instance
**cfxDimensions platform deployment in non-HA mode:** (**option-1**)
When cfxDimensions platform is deployed in non-HA mode, the below list provides a minimum number of server VM instances to be deployed.
| **cfxDimensions Service Type** | OVF profile | **Min. number of instances** |
| ------------------------------ | ----------------------------------- | ---------------------------- |
| Infrastructure Services | Platform HA Instance
| 1 |
| Platform Services | Platform POC Instance
| 1 |
| Application Services | Service Instance
| 1 |
| cLambda (Serverless) Services | cLambda Instance
| 1 |
**cfxDimensions platform deployment in non-HA mode:** (**option-2**)
When cfxDimensions platform is deployed in non-HA mode, below list provides minimum number of server VM instances to be deployed.
| **cfxDimensions Service Type** | OVF profile | **Min. number of instances** |
| ------------------------------ | ------------------------------- | ---------------------------- |
| Platform Services | Platform Instance
| 1 |
| Application Services | Service Instance
| 1 |
| cLambda (Serverless) Services | cLambda Instance
| 1 |
**cfxDimensions platform deployment in HA mode:**
When cfxDimensions platform is deployed in distributed for scale and HA mode in production environments, below list provides minimum number of server instance requirement which can tolerate one server node failure and to provide continuity of AIOps application's access.
| **cfxDimensions Service Type** | OVF profile | **Min. number of instances** |
| ------------------------------ | ----------------------------------- | ---------------------------- |
| Infrastructure Services | Platform HA Instance
| 3 |
| Platform Services | Platform POC Instance
| 2 |
| Application Services | Service Instance
| 2 |
| cLambda (Serverless) Services | cLambda Instance
| 2 |
**Step 1**: Download the latest OVF binary image from CloudFabrix (or contact ).
**OVF Details:** RHEL/CentOS 8.3
**Step 2**: Login to VMware vCenter Webclient
{% hint style="info" %}
**Note**: It is expected that the user who is deploying VMs for CloudFabrix cfxDimensions platform, have sufficient VMware vCenter privileges. Also, has necessary pre-requisite credentials and details handy (e.g IP Address/FQDN, Gateway, DNS & NTP server details).
{% endhint %}
**Step 3**: Select a vSphere cluster/resource pool in vCenter and right click on it and then select -> Deploy OVF Template as shown below.

**Step 4**: Select the OVF image from the location it was downloaded.

:warning: **Note:** When VMware vSphere Webclient is used to deploy OVF, it expects to select all the files necessary to deploy OVF template. Select all the binary files (.ovf, .mf, .vmdk files) for deploying VM.


\
**Step 5**: Click Next and Enter appropriate 'VM Name'. While deploying VMs for cfxDimensions platform, there are different types of VMs that need to be deployed and they are 'Platform', 'Service', 'cLambda' and external DB/Data nodes (optional).

**Step 6**: Click Next and select the appropriate vSphere Cluster / Resource pool where the cfxDimensions VM is going to be deployed.

**Step 7**: Click Next and you are navigated to deployment configuration view. Select the instance of VM from the configuration drop-down provided. The following configuration options are available to choose from during the deployment.
* Platform Instance
* Service Instance
* cLambda Instance
* Platform Data Instance
Select '**Platform Instance**' as shown below. (For POC/Staging/Lab/Test environments, please select '**Platform Data Instance**').

**Step 8**: Click Next and you are navigated to selecting the Datastore (Virtual Storage). Select Datastore / Datastore Cluster where you want to deploy the VM. Make sure you select '**Thin Provision**' option as highlighted in the below screenshot.

**Step 9**: Click Next and you are navigated to 'Network port-group' view. Select the appropriate Virtual Network port-group as shown below.

**Step 10**: Click Next and you are taken to Network Settings/Properties as shown below.\
Note: CloudFabrix highly recommends to provide all the necessary network details as per network requirements.
* Default OVF username and password is '**macaw**' and '**macaw1234**' (Update the password field to change default password)
{% hint style="warning" %}
Please make sure to use same password for '**macaw**' user on all of the VMs (Platform, DB/Data, Services & cLambda)
{% endhint %}

**Step 11**: Adjust the Disk size settings based on the environment size. For any help in this section, please contact .

**Step 12:** Click Next and final view 'Ready to Complete' with a summary of deployment settings are displayed. Click **Finish** as shown below to deploy the VM using the OVF template and to create the platform/service/clambda/db or data node VMs.

**Step 13**: Before powering ON the deployed VM, please follow the below steps to make sure '**VMware Tools**' option is selected (as shown in the below screenshots).


**Step 14**: Edit the VM settings and adjust the CPU and Memory settings based on the environment size. For any help/guidance in this section, please contact .
**Step 15:** Power ON the VMs and wait until it is completely up with OVF settings. It usually takes around 2 to 5 minutes.
{% hint style="warning" %}
Repeat the above steps for provisioning below required VMs for cfxDimensions platform. At step 7, select the following option to create respective VMs.
* Service Instance
* cLambda Instance
* Platform HA Instance (for external DB/Data node (optional))
{% endhint %}
# Post cfxDimensions VM Installation
**Step 1:** Login into Platform VM using any SSH client (ex: putty). Default username is '**macaw**'
Run the following commands on the Platform VM.
```
sudo firewall-cmd --permanent --add-port=8080/tcp
sudo firewall-cmd reload
```
**Step 2:** Verify that NTP time is in sync on all of the cfxDimensions Platform, Service, cLambda & DB/Data nodes.
{% hint style="info" %}
**Note:** On RHEL/CentOS 7.6 or above, please refer /etc/ntp.conf file. On RHEL/CentOS 8.3 or above, pleae refer /etc/chrony.conf file
{% endhint %}
To manually sync VM's time with NTP server.
**RHEL / CentOS 8.3 or above:**
```
sudo systemctl stop chronyd
sudo chronyd -q 'server iburst'
sudo systemctl start chronyd
```
**Timezone settings:** Below are some of the useful commands to view / change / set Timezone on cfxDimensions VMs.
```
sudo tzselect
```
```
sudo timedatectl
```
```
sudo timedatectl set-timezone Europe/London
```
###
### HTTP Proxy Settings:
CloudFabrix cfxDimensions platform is built on micro services architecture ontop of underlying Docker Container infrastructure. cfxDimensions platform and AIOps application service's container images are hosted on secure Docker registry running on AWS cloud.
During deployment, [**macaw CLI**](/implementer-guide/platform-installation/macaw-cli) (a command line tool built by CloudFabrix to orchestrate the provisioning of cfxDimensions platform and application services) connects to CloudFabrix's Docker registry to pull the necessary container images over internet.
{% hint style="info" %}
**Note:** Internet access is needed only during initial deployment and upgrades (when needed).
{% endhint %}
If there is a HTTP proxy server is deployed to control the internet access, apply the below HTTP proxy settings on all cfxDimensions Platform, Service, cLambda and DB/Data nodes.
**Step 1:** On cfxDimensions Platform, Service, cLambda and DB/Data nodes, edit **/etc/environment** file and define HTTP Proxy server settings as shown below.
```
http_proxy="http://:@10.95.142.10:3128"
https_proxy="http://:@10.95.142.10:3128"
no_proxy="localhost,127.0.0.1,10.95.192.201,10.95.192.202,10.95.192.203,10.95.192.204,*.rhel.pool.ntp.org,*.us.pool.ntp.org"
HTTP_PROXY="http://:@10.95.142.10:3128"
HTTPS_PROXY="http://:@10.95.142.10:3128"
NO_PROXY="localhost,127.0.0.1,10.95.192.201,10.95.192.202,10.95.192.203,10.95.192.204,*.rhel.pool.ntp.org,*.us.pool.ntp.org"
export http_proxy https_proxy no_proxy HTTP_PROXY HTTPS_PROXY NO_PROXY
```
{% hint style="info" %}
**Note:** IP Address details are given for a reference only. They need to be replaced with appropriate HTTP Proxy server IP and port applicable to your environment.
{% endhint %}
{% hint style="warning" %}
**Note:** For **no\_proxy** and **NO\_PROXY** environment variables, please include loopback and IP addresses of all Platform, Service, cLambda and DB/Data nodes. This will ensure to avoid internal CloudFabrix AIOps application traffic going through HTTP proxy server.
Additionally, include any target applications or devices IP address or DNS names where it doesn't require to go through HTTP Proxy server.
{% endhint %}
**Step 2:** Configure Docker Daemon with HTTP Proxy sever settings.
```
sudo mkdir -p /etc/systemd/system/docker.service.d
cd /etc/systemd/system/docker.service.d
```
Create a file called '**http-proxy.conf**' under above directory and add the HTTP Proxy configuration lines as shown below.
```
vi http-proxy.conf
```
```
[Service]
Environment="HTTP_PROXY=http://:@10.95.142.10:3128"
Environment="HTTPS_PROXY=http://:@10.95.142.10:3128"
Environment="NO_PROXY=localhost,127.0.0.1,10.95.192.201,10.95.192.202,10.95.192.203,10.95.192.204,*.rhel.pool.ntp.org,*.us.pool.ntp.org"
```
{% hint style="warning" %}
If there is an username and password required for HTTP Proxy server authentication, and if the username has any special characters like "\\" (ex: username\domain), it need to be entered in HTTP encoded format. This is applicable only for Docker daemon. Please follow the below instructions.
{% endhint %}
**HTTP Encode / Decode URL:** [https://www.urlencoder.org](https://www.urlencoder.org/)
If the username is **john\acme.com** : The HTTP encoded value is **john%5Cacme.com** and the HTTP Proxy configuration looks like below.
```
[Service]
Environment="HTTP_PROXY=http://john%5Cacme.com:password@10.95.142.10:3128"
Environment="HTTPS_PROXY=http://john%5Cacme.com:password@10.95.142.10:3128"
Environment="NO_PROXY=localhost,127.0.0.1,10.95.192.201,10.95.192.202,10.95.192.203,10.95.192.204,*.rhel.pool.ntp.org,*.us.pool.ntp.org"
```
**Step 3:** Restart the Platform, Service, cLambda & DB/Data node VMs to apply the HTTP Porxy server settings.
### Whitelist URLs of CloudFabrix external repositories: (Internet outbound access)
Below list of URLs to be whitelisted (for outbound access only) when CloudFabrix dimentions platform is deployed in a restricted environment to access platform and application software images during the platform setup, configuration and for on going updates.
*
*
*
*
*
*
# SSL Certificates Installation
SSL Certificates for secure communication
CloudFabrix's dimensions platform is enabled with HTTPs (SSL/443) access by default for secure communication and it is installed with self-signed certificates during the deployment. However, for production deployments, it is highly recommended to install CA Signed certificates and the below steps help you to install them appropriately.
cfxDimensions platform uses HA Proxy service for managing UI access, incoming traffic (ex: Alert notifications) securely over HTTPs (SSL/443) protocol, and internal application traffic where applicable.
Below steps to provide how to install CA Signed SSL certificates for HA Proxy service.
### SSL Certificate Requirements:
CloudFabrix's dimensions platform's HA Proxy service requires below CA signed SSL certificate files in PEM format.
* server-ssl-certificate.crt (format: PEM)
* server-ssl-private.key
* trusted-ca-intermediate-root.crt (format: PEM)
* trusted-ca-root.crt (format: PEM)
**OR**
* server-ssl-certificate.crt (format: PEM)
* server-ssl-private.key
* trusted-ca-intermediate-root.crt & trusted-ca-root.crt chain in a single file (format: PEM)
The SSL server certificate that is obtained should match the DNS / FQDN of the cfxDimensions platform VM's IP address (This is also referred to as Common Name or CN within the certificate). Wildcard domain SSL certificate is also supported. The below screen provides an example of how to check the server's ssl certificate's CN name using **openssl** command. (In this example, the cfxDimension platform's FQDN is cfx-dimensions.cloudfabrix.io and using a wildcard domain name (CN) SSL certificate)
```
openssl crl2pkcs7 -nocrl -certfile server-ssl-certificate.crt | openssl pkcs7 -print_certs -noout
```

Once you have the SSL certificate files as mentioned above, you need to create an SSL certificate chain by grouping them together as a single file in PEM format.
Th below diagram shows a valid CA signed SSL certificate chain flow for reference.

Run the below command to create a valid SSL certificate chain. (supported format is PEM)
```
cat server-ssl-private.key server-ssl-certificate.crt trusted-ca-intermediate-root.crt trusted-ca-root.crt > cfx-ssl-haproxy.pem
```
**OR**
```
cat server-ssl-private.key server-ssl-certificate.crt trusted-ca-intermediate-and-root-chain.crt > cfx-ssl-haproxy.pem
```

{% hint style="info" %}
The final consolidated SSL certificate chain output is saved to '**cfx-ssl-haproxy.pem**' file which will be applied to HA Proxy configuration later in this document. The filename used here for reference only.
{% endhint %}
###
### CA-signed SSL certificate verification:
{% hint style="info" %}
Note: **openssl** tool is a pre-requisite for performing SSL certificate validation checks
{% endhint %}
**Step 1:** Run the below commands to verify both server's SSL certificate and private key. The output of these two commands should match exactly the same.
```
openssl x509 -noout -modulus -in server-ssl-certificate.crt | openssl md5
```
```
openssl rsa -noout -modulus -in server-ssl-private.key | openssl md5
```
**Step 2:** Run the below commands to verify server's SSL certificate, intermediate & root certificate's (chain) date is valid and not expired.
```
openssl x509 -noout -in server-ssl-certificate.crt -dates
```
```
openssl x509 -noout -in trusted-ca-root.crt -dates
```
```
openssl x509 -noout -in trusted-ca-intermediate-root.crt -dates
```
**Step 3:** Run the below commands to verify the public keys contained in the private key file and the server certificate file are the same. The output of these two commands should match.
```
openssl x509 -in server-ssl-certificate.crt -noout -pubkey
```
```
openssl rsa -in server-ssl-private.key -pubout
```
**Step 4:** Run the below command to verify the validity of the certificate chain. The response should come out as '**OK**'.
```
openssl verify -CAfile trusted-ca-root.crt server-ssl-certificate.crt
```
**OR**
```
openssl verify -CAfile trusted-ca-intermediate-and-root-chain.crt server-ssl-certificate.crt
```
**Step 5:** Run the below command to see and verify SSL certificate chain order is correct.
```
openssl crl2pkcs7 -nocrl -certfile cfx-ssl-haproxy.pem | openssl pkcs7 -print_certs -noout
```
Please refer to the below screenshot on how to validate the SSL certificate chain order.

Verify if the SSL certificate and key is in PEM format
```
openssl rsa -inform PEM -in server-ssl-private.key
openssl x509 -inform PEM -in server-ssl-certificate.crt
```
###
### CA-signed SSL Certificate Installation for HA Proxy service:
**Step 1:** Go to HA Proxy service's certificates path on the cfxDimensions platform machine.
```
cd /opt/macaw/macaw-platform-/certificates//haproxy
```
**Step 2:** Take a backup of the existing HA Proxy service's SSL certificate
```
cp haproxy.pem haproxy.pem.backup
```
**Step 3:** Copy the CA-signed SSL certificate chain file that is in PEM format to this location as '**haproxy.pem**'
```
cp /cfx-ssl-haproxy.pem haproxy.pem
```
**Step 4:** Restart HA Proxy container
```
docker ps -a | grep haproxy
```
```
docker restart
```
**Step 5:** Verify HA Proxy service logs to make sure there are no errors after installing CA signed SSL server certificate chain file.
```
docker logs -f --tail 200
```
**Step 6:** Run the below '**openssl**' command to verify the newly installed SSL certificate and check SSL verification is shown as '**OK**' without any validation failures.
```
openssl s_client -connect :443
```
**Step 7:** Open an internet browser (Firefox / Chrome / Safari) and enter the cfxDimensions Platform's FQDN to access the UI securely over HTTPs (port: 443) protocol.
**https\://\**
## **Appendix:**
### **SSL Certificate Formats and Conversion:**
SSL certificate files come in different formats and most common ones that CA's (Certificate Authorities) deliver include .pfx, .p7b, .pem, .crt, .cer, and .cert. You can get more details about these different certificate formats in the following link:
[SSL Certificate file format's explanation](https://comodosslstore.com/resources/a-ssl-certificate-file-extension-explanation-pem-pkcs7-der-and-pkcs12/)\
\
If you need to convert the format of your SSL certificate files to PEM, please use the following commands:
* **Convert PFX to PEM**
```
openssl pkcs12 -in server-ssl-certificate.pfx -out server-ssl-certificate.pem -nodes
```
* **Convert P7B to PEM**
```
openssl pkcs7 -print_certs -in server-ssl-certificate.p7b -out server-ssl-certificate.pem
```
* **Convert DER to PEM**
```
openssl x509 -inform der -in server-ssl-certificate.cer -out server-ssl-certificate.pem
```
You can use the following commands to check if your certificate files are already in the required format:
* **Check and verify if your key is in PEM format**
```
openssl rsa -inform PEM -in server-ssl-private.key
```
* **Check and verify if your certificate is in PEM format**
```
openssl x509 -inform PEM -in server-ssl-certificate.pem
```
###
### Self Signed SSL Certificate with Custom CA Root:
The **truststore or root store** is a file that contains the root certificates for Certificate Authorities (CA) that issue SSL certificates such as GoDaddy, Verisign, Network Solutions, Comodo and others. Internet browsers, operating systems and applications include list of authorized SSL certificate authorities within their root store or truststore repository file.
However, many enterprises may use Custom CA root certificates to validate and certify self-signed SSL certificates for internal use. In such scenario, when an application is being accessed through a browser or an SSL client, SSL certificate verification error may be observed. Because, neither the browser nor the SSL client will have the Custom CA root certificate within their root store / truststore repository file and hence, they will fail to recognize the authenticity of the SSL certificate and the issuer (CA) from the application.
In order to resolve this issue, update the client's root store / truststore with the Custom CA root & intermediate root certificates so that they can recognize them as a valid & trusted Certificate Authority (CA). Please refer the client's (internet browser or application) documentation on how to update their root store / truststore with custom CA root certificates.
{% hint style="danger" %}
Note: Please take guidance from your internal security team while using self-signed SSL certificates with Custom CA root certificates.
{% endhint %}
# cfxDimensions Setup & Install
This section explains how to install using CLI.
### Prerequisites:
1. All the VMs used for deploying cfxDimenions are expected to contain "Python 3.x" as default python version.\
\
**Note: CloudFabrix delivered OVF (VM's) are by default enabled with Python 3.x environment.**
2. Please make sure that the docker images, volumes are cleared from the Platform, Service, and cLambda VMs.
3. Make sure all hardware requirements are met as in [Hardware and Software section.](/implementer-guide/platform-installation/hardware-and-software#hardware-requirements)
{% hint style="info" %}
Deploy the latest Macaw CLI tool binary from CloudFabrix Software Inc.\
(Please contact )
{% endhint %}
### Installation of cfxDimensions Platform using Macaw CLI
**Step 1**: CloudFabrix provides CLI tool which is called as Macaw CLI.
[Macaw CLI is a command line management tool](/implementer-guide/platform-installation/macaw-cli) that is used to setup, install/deploy and manage CloudFabrix AIOPs platform.
{% hint style="info" %}
Execute the following commands in the order given below.
{% endhint %}
**Step 2**: '[**macaw setup**](/implementer-guide/platform-installation/macaw-cli/macaw-cli-setup)' is a pre-requisite command to complete and after which, run the below command to Install cfxDimensions Infrastructure services using the following command.
```
macaw infra install --tag macaw-1.0.1
```


**Step 3**: Initialize the Platform database (MySQL DB) using the following command.
```
macaw platform dbinit --tag macaw-1.0.1 --clean
```
Enter cfxDimensions **Platform admin's** username (**Ex:** ), email address and password. Platform admin user has super admin privileges to deploy, manage and maintain cfxDimensions platform and application services from console UI.

**Step 4**: Install Platform services using the following command
```bash
macaw platform install --tag macaw-1.0.1
```


**Step 5**: After the successful installation and configuration of the above, you can access cfxDimensions Console UI at https\://\/console-ui.
{% hint style="info" %}
**Note**: cfxDimensions Console UI and Macaw DevOps Console UI are the same as cfxDimensions uses Macaw DevOps platform
{% endhint %}

**Step 6:** Once logged in, the dashboard displays all the platform and service applications status as shown below.

### How to upgrade cfxDimensions Platform
CloudFabrix releases regular updates to the core platform (also called Macaw Platform). CloudFabrix Software provides you with the latest binary tag to be used for upgrades.
Please use the following commands/steps in the order and replace \ with the actual URL provided to you by CloudFabrix.
**Note**: The following procedure assumes the current version of the cfxDimensions core platform is 1.0.1 and you have received new cfxDimensions core version 1.0.3.
```
pip install --user https://tools/macaw-1.0.3.tar.gz
macaw services stop
macaw platform stop
macaw infra delete
macaw infra install --tag macaw-1.0.3
macaw platform upgrade --tag macaw-1.0.3
macaw services start
```
### Delete old containers
Once the upgrade to new version is successful, you can delete the old containers permanently by executing the following command.
```
macaw platform commit
```
### Revert to old container
If the upgrade to latest tag has failed, then you can revert the upgrade to older(current) version by executing the following command.
```
macaw platform rollback
```
###
{% content-ref url="/pages/-MCpddI9sN0vkAqUmOMj" %}
[Known Issues](/implementer-guide/platform-installation/cfxdimensions-setup-and-install/known-issues)
{% endcontent-ref %}
# Known Issues
The following section documents some of the known issues while provisioning/updating the platform using CLI.
{% hint style="info" %}
Always contact CloudFabrix support in case of any clarification.
{% endhint %}
* If scale-up of any service-cluster has to be used(even in old platforms), please don’t select the “Update Service Metadata” option. It is not selected by default. If it is used, then it can block the service-cluster after scale-up.
* For provisioning any service with external CLI, please use macaw console. ‘macaw application provision’ command is not working with external CLI.
* Environmental capabilities will be empty for service clusters if users provision through the ‘macaw application provision’ command. Please use Console-UI if these values need to be set during provisioning.
* When the container of any service is restarting, please don’t do a rolling update or scale-up, or provisioning on that service. First, the restarting container has to be manually deleted. Then the total instances of the service need to reach 0 (If the instances are in a registered state, then they will reach unreachable, unavailable states and will be automatically removed). Once total instances are 0, then rolling update/scale-up or provisioning can be done on that cluster.
* macaw application status/start consider only 1 instance per each service cluster, even if there are multiple instances in that cluster.
# cfxDimensions High Availability
cfxDimensions platform high availability architecture
**CloudFabrix's** **cfxDimensions** platform is built using cloud native architecture leveraging microservices using containers for all platform, infrastructure and application services. It supports deploying it in distributed mode to provide high availability and also allows to scale up based on enterprise environment's workload requirements.
Below picture provides high-level architecture of cfxDimensions platform when deployed in distributed mode for scale and with high availability feature.

cfxDimensions platform comes with the below services when deployed in HA & distributed mode.
**Infrastructure Services:**
* **HAProxy**: Loadbalancer service which front-ends the cfxDimensions platform for UI and any incoming traffic access.
* **Apache Tomcat:** For cfxDimensions platform's UI access
* **Kafka / Zookeeper:** Message queue which is used by cfxDimensions platform & application services
* **Minio Object Storage:** Object storage which is used by cfxDimensions platform & application services
* **MariaDB:** Database for cfxDimensions platform and application services
* **Gluster:** Shared storage filesystem which is used by cfxDimensions platform & application services
* **Elasticsearch\*:** Used for Metrics and logs data. (**Note:** It is an optional service and it is not included by default during cfxDimensions platform deployment. It can be deployed as an independent service where needed)
**Platform Services:** cfxDimensions platform provides the core essential foundation services. These platform services provide critical services like identity management, encryption/decryption services for critical data, provisioner service for installing,updating & un-installing microservices, service registry etc. The below listed platform services are mandatory to make cfxDimensions platform functional.
* **Service Registry:** All cfxDimensions platform supported application microservices register with centralized Service Registry regarding service listing, service lookups, and interactions among application microservices or with external clients.
* **Identity:** Identity service provides user identity management, managing tenancy & local users. It supports integration with external identity management solution likes of LDAP/AD/SSO. This service is used by application services for identity management operations.
* **Locker:** It provides a secure way to store and access credentials using multi-level encryptions and advanced security principles similar to that of popular cloud providers.
* **User-preferences:** This service is used to store user specific preference settings in the UI. (Ex: Report settings, column selections, UI report layouts etc..)
* **Notification manager:** It is responsible for sending event notifications to application services about all service lifecycle events.
* **Provisioner:** This is service is responsible for provisioning, de-provisioning and upgrades of cfxDimensions application services. It supports manual or automated placement of application services among available (one or more) service nodes of the platform.
* **Console UI:** It is a supporting service which is used to provide necessary supporting UI related war files for tomcat infrastructure service. It is used only during initial load time. (Note: This service will be deprecated in future)
{% hint style="info" %}
**Consol UI** service is deployed as a single service instance in HA deployment as it is used only during initial loadup time after the initial install of Platform services. It is no longer used post deployment of platform services and run time.
{% endhint %}
**Application Services:**
For AIOps application services, please refer [**cfxOIA Application Services**](/implementer-guide/cfxoia-application-services) section
When cfxDimensions platform is deployed in distributed for scale and HA mode in production environments, below list provides minimum number of server instance requirement which can tolerate one server node failure and to provide continuity of AIOps application's access.
| **cfxDimensions Service Type** | **Min. number of instances (VM / Baremetal)** |
| ------------------------------ | --------------------------------------------- |
| Infrastructure Services | 3 |
| Platform Services | 2 |
| Application Services | 2 |
| cLambda (Serverless) Services | 2 |
{% hint style="info" %}
Note: As of current release, cfxDimensions **infrastructure services** are supported only in 3 server node deployment, if there is a requirement to deploy in more than 3 nodes, please contact CloudFabrix's technical support.
{% endhint %}
### Infrastructure Services in Cluster Mode:
**HAProxy:** HAProxy is a software based load balancer for TCP and HTTP based applications. It is used within the cfxDimensions platform to loadbalance and high availability for infrastructure, platform and application services. Below listed are primary functions of HAProxy within the cfxDimensions platform.
* Front-end UI portal access, alerts/events & API access over HTTP(s) with SSL
* MariaDB access to platform and application services when MariaDB is deployed in cluster mode
* Minio object storage access to platform and application services
* Service registry access among application services
HAProxy service is containarized and configured in a specific way to be compatible with cfxDimensions platform and deployed in Active/Standby mode. It is deployed among 2 of the 3 node infrastructure service nodes. HAProxy's front end and back-end cluster IPs are virtual IPs which are configured and managed through **keepalived** service.
**Keepalived:** Keepalived is a service which is included part of cfxDimensions platform as a standard linux service. Keepalived uses the IP Virtual Server (IPVS) kernel module to provide transport layer (Layer 4) load balancing, redirecting requests for network-based services to individual members of a server cluster. IPVS monitors the status of each server and uses the Virtual Router Redundancy Protocol (VRRP) to implement high availability.
Keepalived service is configured as a Linux service on both Active/Standby nodes of HAProxy service.
It's primary function is to manage the HAProxy's front-end & back-end virtual IPs providing high-availability at network layer. When HAProxy active node (or service) goes down, keepalived detects the failure instantly and automatically transfers the HAProxy cluster virtual IP to HAProxy standby node. The application traffic (internal or external) will be re-routed and processed through HAProxy standby node seemlessly.
**Kafka & Zookeeper:** Kafka is used as a message queue to publish (write) and subscribe to (read) streams of events among application services within the cfxDimensions platform. Kafka natively supports deploying in distributed mode which allows to scale and provide high availability. Zookeeper service is also used along with Kafka service which also deployed in distributed mode to provide high availability and scale.
Kafka & Zookeeper services are containarized and configured in a specific way to be compatible with cfxDimensions platform. When deployed in 3 node configuration along with default replication settings (replication factore is set to 2), it provides 1 node failure tolerance.
For detailed general documentation, please refer [**About Kafka & Zookeeper**](https://kafka.apache.org/documentation/)
**Kafka & Zookeeper disk mount points on each cluster node:**
* Data mount point: (Kafka & Zookeeper)
* /kafka-logs1
* /kafka-logs2
* /Zookeeper
* Service logs path: (Kafka & Zookeeper)
* /opt/macaw/log/kafka/\
* /opt/macaw/log/zookeeper/\
**Minio Object Storage:** MinIO is a high performance Object Storage which is API compatible with Amazon S3 cloud storage service which can be deployed in distributed mode for scale and high availability. It is primarily used to store and query the configuration, ML experiment data, pipelines, alert bundles, inventory and analytical data files etc. Minio service is containarized and configured in a specific way to be compatible with cfxDimensions platform. When deployed in 3 node cluster, it is configured with 12 disk mount points (4 disk mount points per node) in total with Minio rrs storage class/policy is set to EC:4 (i.e. 8 data disks and 4 parity disks)
For detailed general documentation, please refer [**About Minio Object Storage**](https://docs.min.io/)
**Minio object storage disk mount points on each cluster node:**
* Data mount point: (Minio object storage)
* /minio-data01
* /minio-data02
* /minio-data03
* /minio-data04
* Logs:
* Minio container logs
```
docker ps | grep -i minio
docker logs
```
**Gluster shared filesystem:** GlusterFS is a scalable and distributed network filesystem which is used to share the filesystem among cfxDimensions platform application and infrastructure services to share and store service logs, certificates and configuration. Gluster service is containarized and configured in a specific way to be compatible with cfxDimensions platform.
Gluster is deployed in 3 node configuration similar to other infrastructure services. It is deployed as 2 data replication nodes and 1 arbiter node. Each data replication node will contain a data brick volume which is used for data replication between Gluster cluster nodes. For data replication, only two data brick (volume) nodes are used while third node acts as a arbiter node which is aimed at preventing split-brains and providing the data consistency guarantees as a normal replica 3 volume without consuming disk space.
For detailed general documentation, please refer [**About GlusterFS**](https://docs.gluster.org/en/latest/)
{% hint style="info" %}
The configured Gluster volume name is '**macaw**' and it is mounted on all of the cfxDimensions platform VMs as **/opt/macaw** (VMs: Platform, Infrastructure (DB/Data), Application services & cLambda)
{% endhint %}
**GlusterFS shared filesystem mount point on each cluster node:**
* Data mount point: (Gluster data brick)
* /glusterfs01
* Logs:
* Gluster container logs
```
docker ps | grep -i gluster
docker logs
```
**MariaDB Database:** MariaDB is a relational database application service which is used to store user configuration, platform & application configuration, alerts and incident data of cfxDimenions platform and respective application services. MariaDB supports high availability natively and it can be deployed as Master/Slave or Master/Master configuration using Galera clustering feature. Within the cfxDimensions platform MariaDB is deployed in Master/Master (Galera cluster) configuration. MariaDB service is containarized and configured in a specific way to be compatible with cfxDimensions platform and it's application services.
For details general documentation, please refer [**About MariaDB**](https://mariadb.org/documentation/) and [**About Galera Cluster**](https://mariadb.com/kb/en/what-is-mariadb-galera-cluster/)
**MariaDB database mount point on each cluster node:**
* Data mount point:
* /var/mysql
* DB service logs path:
* /opt/macaw/shared/log/mariadb/\/mariadb.log
# GlusterFS Operations
Gluster shared storage filesystem operations
This document provides information on how to check and view Gluster shared storage filesystem configured within the cfxDimensions platform.
Run the below command to see Gluster mount point on any of the cfxDimensions platform VM. (Login as '**macaw**' user using any SSH client to access the CLI)
{% hint style="info" %}
The configured Gluster volume name is '**macaw**' and it is mounted on all of the cfxDimensions platform VMs as **/opt/macaw** (Platform, Infrastructure (DB/Data), Application services & cLambda)
{% endhint %}
```
df -h
```

The Gluster volume is configured to mount as /opt/macaw using the below mount options. Please refer /etc/fstab
**defaults,backup-volfile-servers=192.168.186.152:192.168.186.153,\_netdev,noauto,x-systemd.automount 0 0**
**backup-volfile-servers:** This option is used by the Gluster client while mounting the volume, when the primary Gluster node is not available, it will try backup Gluster node to fetch the volume's metadata and complete the mount operation.
**noauto & x-systemd.automount:** '**noauto'** option is used not to mount during boot-up time automatically. However, it is used along with **x-systemd.automount** option which enables to mount the Gluster volume automatically on access by client service. This is similar to AutoFS feature of NFS shares.
Login as '**macaw**' user into one of the cfxDimensions platform VM on which Gluster is installed. You can get Gluster host information using the below command
```
macaw status
```

**Gluster Host:**
Run the below command to get the container ID of the Gluster service after logging into the host in which it is deployed.
```
docker ps | grep -i gluster
```

The below command lists all of the Gluster peer (cluster nodes) members. It should show all three members of the Gluster.
```
docker exec gluster pool list
```

The below command provides Gluster volume information which is being configured and used within the cfxDimensions platform.
{% hint style="info" %}
The configured Gluster volume name is '**macaw**' and it is mounted on all of the cfxDimensions platform VMs as **/opt/macaw** (Platform, Infrastructure (DB/Data), Application services & cLambda)
{% endhint %}
```
docker exec gluster volume info
```

The below command provides Gluster volume '**macaw**' status.
```
docker exec gluster volume status
```

The below command provides Gluster volume '**macaw**' status in detail (verbose).
```
docker exec gluster volume macaw detail
```

Below command provides insight into Gluster volume '**macaw**' **"heal"** status when one of the Gluster is rebooted or recovered from a crash.
{% hint style="info" %}
Gluster node joins the cluster on reboot and syncs the data automatically from it's peer node.
{% endhint %}
```
docker exec gluster volume heal macaw info summary
```

# Minio Operations
Minio object storage operations
MinIO is a high performance Object Storage which is API compatible with Amazon S3 cloud storage service which can be deployed in distributed mode for scale and high availability. It is primarily used to store and query the configuration, ML experiment data, pipelines, alert bundles, inventory and analytical data files etc within the cfxDimensions platform. When deployed Minio in 3 node cluster, it is configured with 12 disk mount points (4 disk mount points per node) in total with Minio rrs storage class/policy is set to EC:4 (i.e. 8 data disks and 4 parity disks).
**Minio object storage disk mount points on each cluster node:**
* Data mount point: (Minio object storage)
* /minio-data01
* /minio-data02
* /minio-data03
* /minio-data04
To interact with Minio object storage, it has a client called '**mc**', also known as Minio client. It is included part of the cfxDimensions platform on each infrastructure services node on which Minio container service is installed and configured.
Minio client path is '**/opt/minio-client**' and the CLI binary name is '**mc**'
**Configure Minio client to interact with Minio object storage:**
Run the below command which generates initial Minio client's configuration files under **\~/.mc** folder and creates a sample **config.json** file (macaw user's home directory)
```
/opt/minio-client/mc
mc: Configuration written to `/home/macaw/.mc/config.json`. Please update your access credentials.
mc: Successfully created `/home/macaw/.mc/share`.
mc: Initialized share uploads `/home/macaw/.mc/share/uploads.json` file.
mc: Initialized share downloads `/home/macaw/.mc/share/downloads.json` file.
NAME:
mc - MinIO Client for cloud storage and filesystems.
USAGE:
mc [FLAGS] COMMAND [COMMAND FLAGS | -h] [ARGUMENTS...]
```
Edit the **\~/.mc/config.json** file to configure the Minio object storage access credentails which will be used by '**mc**' (Minio client CLI) to interact with Minio.
Modify the '**local**' JSON block as similar to the next screen to the below.
* Change the label from '**local**' to '**minio**'
* Change the URL with **https\://\:9443**
* Enter **accesskey** & **secretkey**
{% hint style="info" %}
Minio object storage credentials can be obtained from Platform VM on which '**macaw**' cli was installed. The minio details are within the **/home/macaw/platform.cfg** configuration file, under **\[minio]** section.
{% endhint %}


Once above configuratio is done, run the below command to verify the Minio access using Minio client CLI tool. It provides overall health status of the 3 Minio object storage nodes and respective disk drive's status.
```
/opt/minio-client/mc admin info --insecure minio
```

In order to see very detailed configuration information of Minio object storage cluster, run the below command. It provides Minio's erasure coding settings with data and partiy disk ratio, each Minio node's uptime, respective disk drive's status and capcaity usage etc...
```
/opt/minio-client/mc admin info --json --insecure minio
```

# MariaDB Operations
MariaDB Database operations
MariaDB is a relational database service that is used to store user configuration, platform & application configuration, alerts, and incident data of cfxDimenions platform and respective application services. MariaDB supports high availability natively and it can be deployed as Master/Slave or Master/Master configuration using the Galera clustering feature. Within the cfxDimensions platform, MariaDB has deployed as Master/Master (Galera cluster) node configuration. MariaDB service is containerized and configured in a specific way to be compatible with cfxDimensions platform and its application services.
For detailed general documentation, please refer to [**About MariaDB**](https://mariadb.org/documentation/) and [**About Galera Cluster**](https://mariadb.com/kb/en/what-is-mariadb-galera-cluster/)
**MariaDB database mount point on each cluster node:**
* Data mount point:
* /var/mysql
* DB service logs path:
* /opt/macaw/shared/log/mariadb/\/mariadb.log
**MariaDB Galera Cluster graceful start & stop sequence:**
Run the below macaw CLI command from Platform VM to start MariaDB cluster service on 3 nodes.
```
macaw infra start --service mariadb
```
The above command brings up each MariaDB Node in sequential order. It brings up Node01 first to bootstrap the cluster and starts the Node02 & Node03 subsequently to join the MariaDB Galera cluster.
When **Node01** is started first to bootstrap the MariaDB galera cluster, it starts with the below parameter set inside the MariaDB configuration file. (**/opt/macaw/config/mariadb/\/mariadb.cnf**)
**`wsrep_new_cluster=1`** (last line of the configuration file)
{% hint style="info" %}
Once the MariaDB Galera cluster is functionally up and running, the determination of the bootstrap node next time to start the cluster depends on the shutdown sequence of the cluster nodes. The cluster node which was stopped last should be used to bootstrap the MariaDB Galera cluster next time.
{% endhint %}
Run the below macaw CLI command from Platform VM to stop the MariaDB cluster service on 3 nodes gracefully.
```
macaw infra stop --service mariadb
```
The above command stops the Node03 first, Node02 next, and finally the Node01. In this sequence, since Node01 is stopped last, Node01 always becomes the bootstrap node to start and initializes the Galera cluster appropriately.
{% hint style="info" %}
Three node MariaDB Galera cluster provides high availability with a tolerance of 1 node failure.
{% endhint %}
### MariaDB Galera cluster multi-node recovery on power failure or a full crash:
If the MariaDB Galera cluster nodes are crashed because of power failure on all servers or because of some other server hardware failure, the cluster needs to be brought up carefully in a particular order to avoid any data loss.
First, we need to identify which node is eligible to bootstrap the MariaDB Galera cluster. For that, below are the two available methods.
1. Identify the node which has highest **`seqno`** value (**Note:** A cluster node will only have positive highest **`seqno`** value when atleast one of the node was able to gracefully shutdown. This is the node that needs to be started first to bootstrap the MariaDB Galera cluster.)
2. Identify the node which has recorded the **last committed** transaction
### **Recover MariaDB Galera cluster using a Node which has the highest `seqno` value:**
Login into MariaDB cluster Node03 using SSH client to access the CLI. (username: macaw)
Following shows the content of **`grastate.dat`** in Node03. In this example, this node has negative seqno and no group ID (uuid). This is the case when a node crashes during Data Definition Language (DDL) processing:
```
$ cat /var/mysql/grastate.dat
# GALERA saved state
version: 2.1
uuid: 00000000-0000-0000-0000-000000000000
seqno: -1
safe_to_bootstrap: 0
```
The following shows the content of **`grastate.dat`** in Node02. In this example, this node was crashed during a transaction processing which resulting in negative seqno but with a group ID (uuid):
```
$ cat /var/mysql/grastate.dat
# GALERA saved state
version: 2.1
uuid: 886dd8da-3d07-11e8-a109-8a3c80cebab4
seqno: -1
safe_to_bootstrap: 0
```
Following is the content of **`grastate.dat`** on Node01 with the highest **`seqno`** value:
```
$ cat /var/mysql/grastate.dat
# GALERA saved state
version: 2.1
uuid: 886dd8da-3d07-11e8-a109-8a3c80cebab4
seqno: 31929
safe_to_bootstrap: 1
```
{% hint style="info" %}
**Note:** If all of the cluster nodes contain the value of **`-1`** for **`seqno`** and **`0`** for **`safe_to_bootstrap`** , that is an indication that a full cluster crash has occurred. Go to the Next Section of this document **(Recover MariaDB Galera cluster using a Node that has committed the last transaction)**
{% endhint %}
The MariaDB node with the highest **`seqno`** value is an appropriate Node to bootstrap the MariaDB Galera cluster.
Follow the below steps to bootstrap and bring up the MariaDB cluster:
**Step-1:** Login into the MariaDB bootstrap node using an SSH client as a macaw user. (bootstrap node is identified using one of the above-mentioned procedures)
**Step-2:** Edit **`mariadb.cnf`** configuration file and make sure the below parameter is set at the end of the file and save it. (Configuration file location: `/opt/macaw/config/mariadb//mariadb.cnf`)
**`wsrep_new_cluster=1`**
**Step-3:** Edit **`/var/mysql/grastate.dat`** file and make sure **`safe_to_bootstrap`** value is set to **`1`**and save the file.
**Step-4:** Start the MariaDB container using the below command.
```
docker start
```
After starting the MariaDB container, watch the log messages @ the below log file
`/opt/macaw/shared/log/mariadb//mariadb.log`
and look for the below log message which confirms the Node is completely up and in the synced state.
`WSREP: Server status change joined -> synced`
Additionally, run the below command to verify the MariaDB cluster bootstrap node is completely up in the synced state.
```
mysql -u -p -h -P 3306 -e "show status like 'wsrep_local_state_comment';"
+---------------------------+--------+
| Variable_name | Value |
+---------------------------+--------+
| wsrep_local_state_comment | Synced |
+---------------------------+--------+
```
Once the MariaDB bootstrap cluster node is up, continue the below steps to bring up the rest of the 2 Nodes.
**Step-5:** Login into the MariaDB rest of the nodes (no specific order) using SSH client as macaw user.
**Step-6:** Edit **`mariadb.cnf`** configuration file and make sure the below parameter **doesn't exist**, if yes, just remove it. (Configuration file location: `/opt/macaw/config/mariadb//mariadb.cnf`)
**`wsrep_new_cluster=1`**
{% hint style="info" %}
The above parameter is applicable only on the MariaDB cluster's bootstrap node which initializes the Galera cluster.
{% endhint %}
**Step-7:** Start the MariaDB container using the below command.
```
docker start
```
After starting the MariaDB container, watch the log messages @ the below log file
`/opt/macaw/shared/log/mariadb//mariadb.log`
and look for the below log message which confirms the Node is completely up and in the synced state.
`WSREP: Server status change joined -> synced`
Additionally, run the below command to verify the MariaDB cluster node is completely up in the synced state.
```
mysql -u -p -h -P 3306 -e "show status like 'wsrep_local_state_comment';"
+---------------------------+--------+
| Variable_name | Value |
+---------------------------+--------+
| wsrep_local_state_comment | Synced |
+---------------------------+--------+
```
{% hint style="info" %}
When second or third nodes are coming up after the crash and syncing up with the Cluster's bootstrap node, it may take few minutes or a little longer to be completely up and synced state.
{% endhint %}
**Step-8:** On the last MariaDB node, please follow the procedure listed in **Step-7**
**Step-9:** Once the MariaDB cluster nodes are completely up and functional, login into Node01 and edit the MariaDB configuration file **`mariadb.cnf`** and make sure to add the below parameter at the end of the file and save it. (Configuration file location: `/opt/macaw/config/mariadb//mariadb.cnf`)
**`wsrep_new_cluster=1`**
On Node2 & Node03, edit the MariaDB configuration file and make sure the above parameter **is not** set. This is to make sure macaw CLI starts the Node01 as cluster bootstrap node first when it is used to bring up the MariaDB cluster nodes.
{% hint style="info" %}
MariaDB Galera cluster node order (i.e Node01, Node02 & Node03) is determined based on the order of comma-separated IP address list provided during the**`macaw setup`**command which configures initial configuration of the cfxDimensions platform.
{% endhint %}
###
### **Recover MariaDB Galera cluster using a Node that has committed the last transaction:**
**Step-1:** Login into MariaDB cluster Node01 using SSH client to access the CLI. (username: macaw)
**Step-2:** Run the below command to find the Mariadb container ID
```
docker ps -a | grep mariadb
```
{% hint style="info" %}
Please make sure the MariaDB container is in a stopped state or run the below command to stop the MariaDB container
{% endhint %}
```
docker stop -t 120
```
**Step-3:** Take a backup of the MariaDB configuration file
```
cp /opt/macaw/config/mariadb//mariadb.cnf /opt/macaw/config/mariadb//mariadb.cnf.bak
```
**Step-4:** Edit the MariaDB configuration file and add the below specified option. (Configuration file location: `/opt/macaw/config/mariadb//mariadb.cnf`)
**`wsrep-recover=1`**
and comment out the below parameter (if it exists)
**`#wsrep_new_cluster=1`**
**Step-5:** Start the MariaDB container to start the MariaDB service and wait for 2 to 3 minutes to allow it to be completely up.
```
docker start
```
**Step-6:** Tail mariadb service log and look for similar to the below message. `(/opt/macaw/shared/log/mariadb//mariadb.log)`
2021-06-07 9:50:36 0 \[Note] WSREP: Recovered position: afa02221-c422-11eb-8a24-96c95f63c95b:**397159**
Note down the above **highlighted value** and follow the same steps from **Step-4** through **Step-6** for Node02 & Node03
The MariaDB node with the latest data will have the **highest value** and that is an appropriate Node to bootstrap the MariaDB Galera cluster.
**Follow the below steps to bring up the MariaDB Galera cluster:**
**Step-1:** Login into the MariaDB bootstrap node (which has the highest recovered position value) using an SSH client as a macaw user. (bootstrap node is identified using one of the above-mentioned procedures)
**Step-2:** Edit **`mariadb.cnf`** configuration file and make sure the below parameter is set at the end of the file and save it. (Configuration file location: `/opt/macaw/config/mariadb//mariadb.cnf`)
**`wsrep_new_cluster=1`**
and remove the below line
**`wsrep-recover=1`**
**Step-3:** Edit **`/var/mysql/grastate.dat`** file and set **`safe_to_bootstrap`** value as **`1`**and save the file.
**Step-4:** Start the MariaDB container using the below command.
```
docker start
```
After starting the MariaDB container, watch the log messages @ the below log file
`/opt/macaw/shared/log/mariadb//mariadb.log`
and look for the below log message which confirms the Node is completely up and in the synced state.
`WSREP: Server status change joined -> synced`
Additionally, run the below command to verify the MariaDB cluster bootstrap node is completely up in the synced state.
```
mysql -u -p -h -P 3306 -e "show status like 'wsrep_local_state_comment';"
+---------------------------+--------+
| Variable_name | Value |
+---------------------------+--------+
| wsrep_local_state_comment | Synced |
+---------------------------+--------+
```
Once the MariaDB bootstrap cluster node is up, continue the below steps to bring up the rest of the 2 Nodes.
**Step-5:** Login into the MariaDB rest of the nodes (no specific order) using SSH client as macaw user.
**Step-6:** Edit **`mariadb.cnf`** configuration file and make sure the below parameter doesn't exist, if yes, just remove it. (Configuration file location: `/opt/macaw/config/mariadb//mariadb.cnf`)
**`wsrep_new_cluster=1`**
and remove the below line as well
**`wsrep-recover=1`**
**Step-7:** Start the MariaDB container using the below command.
```
docker start
```
After starting the MariaDB container, watch the log messages @ the below log file
`/opt/macaw/shared/log/mariadb//mariadb.log`
and look for the below log message which confirms the Node is completely up and in the synced state.
`WSREP: Server status change joined -> synced`
Additionally, run the below command to verify the MariaDB cluster node is completely up in the synced state.
```
mysql -u -p -h -P 3306 -e "show status like 'wsrep_local_state_comment';"
+---------------------------+--------+
| Variable_name | Value |
+---------------------------+--------+
| wsrep_local_state_comment | Synced |
+---------------------------+--------+
```
{% hint style="info" %}
When second or third nodes are coming up after the crash and syncing up with the Cluster's bootstrap node, it may take few minutes or a little longer to be completely up and synced state.
{% endhint %}
**Step-8:** On the last MariaDB node, please follow the procedure listed in **Step-6**
**Step-9:** Once the MariaDB cluster nodes are completely up and functional, login into **Node01** and edit the MariaDB configuration file **`mariadb.cnf`** and make sure to add the below parameter at the end of the file and save it. (Configuration file location: `/opt/macaw/config/mariadb//mariadb.cnf`)
**`wsrep_new_cluster=1`**
On **Node2** & **Node03**, edit the MariaDB configuration file and make sure the above parameter is not set. This is to make sure macaw CLI starts the **Node01** as cluster bootstrap node first when it is used to bring up the MariaDB cluster nodes.
{% hint style="info" %}
MariaDB Galera cluster node order (i.e Node01, Node02 & Node03) is determined based on the order of comma-separated IP address list provided during the**`macaw setup`**command which configures initial configuration of the cfxDimensions AIOps platform.
{% endhint %}
# cfxDimensions Start, Stop order
cfxDimensions infra, platform, application services start, stop order
This section explains how to safely start and stop the cfxDimensions infrastructure, platform & application services.
### Starting cfxDimensions Services: Order of steps (Infrastructure, Platform & Application services)
Login into cfxDimensions platform VM using SSH client as '**macaw**' user for CLI access and start the below services in sequence.
* Infrastructure Services
* Platform Services
* Application Services
Starting cfxDimensions platform infrastructure services:
```
macaw infra start
```
Verify cfxDimensions platform's infrastructure services status and make sure all of them are up & running.
```
macaw infra status
```

{% hint style="info" %}
Please wait for 60 to 90 seconds before starting cfxDimensions platform's platform services
{% endhint %}
```
macaw platform start
```
Verify cfxDimensions platform's platform services status and make sure all of them are up & running.
```
macaw platform status
```

{% hint style="info" %}
Please wait for 60 to 90 seconds before starting cfxDimensions platform's application services
{% endhint %}
```
macaw services start
```
Verify cfxDimensions platform's application services status and make sure all of them are up & running.
```
macaw services status
```

### Stopping cfxDimensions Services: Order of steps (Application, Platform & Infrastructure services)
Login into cfxDimensions platform VM using SSH client as '**macaw**' user for CLI access and stop the below services in sequence.
* Application Services
* Platform Services
* Infrastructure Services
To stop cfxDimensions platform's Application services, run the below command. Wait until all of the services are stopped.
```
macaw services stop
```
```
macaw services status
```
To stop cfxDimensions platform's Platform services, run the below command. Wait until all of the services are stopped.
```
macaw platform stop
```
```
macaw platform status
```
To stop cfxDimensions platform's Infrastructure services, run the below command. Wait until all of the services are stopped.
```
macaw infra stop
```
```
macaw infra status
```
# Macaw CLI
Macaw CLI is a very comprehensive command line management tool that is used to setup, install/deploy and manage CloudFabrix AIOPs platform and application services. Below are some of the key type of operations it support.
* cfxDimensions Platform Setup
* Platform Nodes
* Service Nodes
* cLambda Nodes
* Install and Manage cfxDimensions services
* Infrastructure Services
* Platform Services
* Application Services
* Maintenance Operations
* Backup & Restore
# macaw CLI Installation
Login as '**macaw**' user into Platform VM using any SSH client tool (ex: putty)
**(Note:** Default 'macaw' user's password is 'macaw1234' until unless it is changed during cfxDimensions OVF deployment time)
# macaw CLI v2.1.17
Run the following command to install the Macaw CLI tool.
{% hint style="info" %}
**Note:** Please contact CloudFabrix support/sales to get the download URL or offline Macaw CLI install package.
The current Macaw CLI binary used is **macawcli-2.2.17.tar.gz.** \
The instructions provided are valid for all versions of cfxDimensions platform installation unless specifically detailed wherever required.
{% endhint %}
```
pip install --user https:///tools/macawcli-2.2.17.tar.gz
```

Run the below command to verify installed Macaw CLI version
```
macaw --version
```
Run the below command to view the Macaw CLI help
```
macaw --help
Documented commands (type help ):
----------------------------------------
application clambda gluster infra reset services status user
backup exit help platform restore setup techsupport whoami
```
# macaw setup
cfxDimensions platform initial configuration setup
## cfxDimensions platform configuration setup: (HA / non-HA)
Run the below '**macaw setup**' command to create the cfxDimensions platform's deployment configuration. It is a pre-requisite before cfxDimensions infrastructure, platform and application services can be installed.
When cfxDimensions platform is deployed in distributed for scale and HA mode in production environments, below list provides minimum number of server instance requirement which can tolerate one server node failure and to provide continuity of AIOps application's access.
| **cfxDimensions Service Type** | **Min. number of instances (VM / Baremetal)** |
| --------------------------------- | --------------------------------------------- |
| Infrastructure Services (DB/Data) | 3 |
| Platform Services | 2 |
| Application Services | 2 |
| cLambda (Serverless) Services | 2 |
{% hint style="info" %}
Note: As of current release, cfxDimensions **infrastructure services** are supported only in 3 server node deployment, if there is a requirement to deploy in more than 3 nodes, please contact CloudFabrix's technical support.
{% endhint %}
Run the below '**macaw setup**' command to create the cfxDimensions platform's deployment configuration in High Availability mode. It is a pre-requisite before cfxDimensions infrastructure, platform and application services can be installed.
{% hint style="warning" %}
**Note:** When cfxDimensions platform VMs are configured with 2 NIC interfaces, one is for management and another one is for internal application traffic, during '**macaw setup**', please use second NIC's IP while selecting platform, infrastructure, services and clambda VMs.
**HAProxy Virtual IP:** For UI and external access, use management subnet's IP address and for internal application services traffic, use internal subnet's IP address.
{% endhint %}
{% hint style="warning" %}
**Note:** It is recommended to install GlusterFS, Kafka, Zookeeper, MariaDB, Minio, Tomcat & HAProxy services on same set of VMs.
For HAProxy, requires only 2 VM's IP addresses are needed out of selected 3 VMs, but rest of the above infrastructure services need all 3 VM's IP addresses.
{% endhint %}
It will prompt for all the necessary configuration details.
```
macaw setup
```
{% hint style="info" %}
**Note:** Accept the EULA agreement.
{% endhint %}


1. Enter SSH password of '**macaw**' user of all cfxDimensions platform VMs (platform, DB/Data, service & cLambda) (**Note:** The macaw user's ssh password should be same on all of the VMs)
2. Enter **Platform VM IP Address(es):** (**Note:** In case of HA deployment, minimum of 2 Platform VM IPs need to be provided in a comma separated format. For non-HA deployment, only one platform IP address is required)
3. Enter **Application** **Service(s) VM IP Address(es):** (**Note:** In case of HA deployment, minimum of 2 Application service VM IPs need to be provided in a comma separated format. For non-HA deployment, only one platform IP address is required)
4. Enter **Gluster server VM IP Address(es)**: (**Note:** In case of HA deployment, minimum of 3 Gluster server VM IPs need to be provided in a comma separated format. For non-HA deployment, only one Gluster IP address is required. Please check [GlusterFS Operations](/implementer-guide/platform-installation/cfxdimensions-high-availability/glusterfs-operations) for more information)
5. Enter **Docker image tag to install Gluster server**: macaw-2.2.17
6. Enter **cLambda(s) VM IP Address(es):** When more than one cLambda VM is deployed, enter comma separated values.
7. Enter **HAProxy loadbalancer VM IP Address(es)**: (**Note:** In case of HA deployment, minimum of 2 HAProxy VM IPs need to be provided in a comma separated format. For non-HA deployment, only one HAProxy VM IP address is required)
8. Enter **advertized external interface name**: type eth0
9. Enter **advertized external host (IP Address of eth0)**: Enter IP Address using which cfxDimensions platform UI is going to be accessed
10. Enter **advertized internal interface name**: type eth0 / eth1 (Use eth1 when VMs are configured with dual NICs, one is for management access and another one is for internal application traffic)
11. Enter **advertized internal host (IP Address of eth1)**: Enter IP Address using which cfxDimensions platform's application services are communicated (traffic between AIOps application services and back-end platform services like Database, Kafka messaging and Minio object storage)
12. Enter the VM IP Address of **Tomcat servers**: (**Note:** In case of HA deployment, minimum of 2 tomcat server VM IPs need to be provided in a comma separated format. For non-HA deployment, only one Tomcat server IP address is required.)
13. Enter the VM IP Address of **Zookeeper** host(s): (**Note:** In case of HA deployment, minimum of 3 Zookeeper VM IPs need to be provided in a comma separated format. For non-HA deployment, only one Zookeeper IP address is required.)
14. Enter the VM IP Address of **Kafka** host(s): (**Note:** In case of HA deployment, minimum of 3 Kafka VM IPs need to be provided in a comma separated format. For non-HA deployment, only one Kafka IP address is required.)
15. Enter the VM IP Address of **Minio** host(s): (**Note:** In case of HA deployment, minimum of 3 Minio VM IPs need to be provided in a comma separated format. For non-HA deployment, only one Minio IP address is required.)
16. Enter the VM IP Address **MariaDB** host(s). (**Note:** In case of HA deployment, minimum of 3 MariaDB VM IPs need to be provided in a comma separated format. For non-HA deployment, only one MariaDB IP address is required.)
17. Enter the MariaDB user account name. '**macawadmin**' is the default username.
18. Enter the MySQL DB user's password.
{% hint style="info" %}
Note: Please make sure to user only **alphanumeric** character for the password and do not use special characters.
Note down the MariaDB user macawadmin's password and store it safe, it will be needed while installing OIA - Operations intelligence & analytics (AIOps) application services.
{% endhint %}

'**macaw setup**' command creates and stores the cfxDimensions platform configuration under **/home/macaw/platform.cfg** file.
{% hint style="danger" %}
**Note:** Please do not delete this configuration **platform.cfg** configuration file, for more information about the configuration parameters within this platform.cfg file, please refer **platform.README** file under **/home/macaw** directory.
{% endhint %}
Once '**macaw setup**' is completed, run the below commands in sequence to complete installing cfxDimensions platform's infrastructure and platform services.
```
macaw infra install --tag
```
```
macaw platform dbinit --tag
```
After executing the above command, it asks the below questions.
**Platform User\[]:** (Enter or press enter to accept default platform admin username)
**Platform User Email\[]:** (Enter email address of platform admin user or press enter to accept default email address)
**Platform User Password:** (Enter platform admin user's password)
```
macaw platform install --tag
```
# macaw infra
## cfxDimensions Infrastructure services management:
'**macaw infra**' command is used to deploy and manage cfxDimensions infrastructure services. Run the below command to view available CLI options.
```
macaw infra --help
usage: infra [--insecure] [-h] [--debug]
{status,install,start,stop,remove-stopped-containers} ...
Manage infra services
positional arguments:
{status,install,start,stop,remove-stopped-containers}
status Status of the Macaw Infra
install Install the Macaw Infra containers
start Start the Macaw Infra Containers
stop Stop the Macaw Infra Containers
remove-stopped-containers
Remove infra containers that have exited
optional arguments:
--insecure Ignore SSL certificate issues when communicating with
various hosts
-h, --help show this help message and exit
--debug Enable debug logs for the CLI operations
```
'**macaw infra install**' command is used to deploy/install cfxDimensions infrastructure services. Run the below command to view the available options.
```
macaw infra install --help
usage: macaw infra install [-h] [--debug] --tag TAG [--refresh-auth]
[--service SERVICE]
optional arguments:
-h, --help show this help message and exit
--debug Enable debug logs
--tag TAG Tag to be pulled from the Docker registry
--refresh-auth Refresh Authentication to Docker Registry.
--service SERVICE Restrict the scope of the command to specific service
```
Run the below command to deploy all cfxDimensions infrastructure services. (**Note:** Below shown tag name is a sample one for a reference only, for actual tag, please contact CloudFabrix support/sales team.)
```
macaw infra install --tag macaw-2.2.17
```
Run the below command to install a specific cfxDimensions infrastructure service. Below are the supported infrastructure services. (**Note:** Below shown tag name is a sample one for a reference only, for actual tag, please contact CloudFabrix support/sales team.)
* tomcat
* haproxy
* kafka
* zookeeper
* mariadb
* minio
```
macaw infra install --service tomcat --tag macaw-2.2.17
```
Run the below command to delete all cfxDimensions infrastructure services.
{% hint style="danger" %}
Warning: It is a disruptive operation, please take a full backup of your data before you perform this operation on a Production environment.
{% endhint %}
```
macaw infra stop
macaw infra remove-stopped-containers
```
Run the below command to delete a specific cfxDimensions infrastructure service. Below are the list of infrastructure services.
* tomcat
* haproxy
* kafka
* zookeeper
* mariadb
* minio
{% hint style="danger" %}
Warning: It is a disruptive operation, please take a full backup of your data before you perform this operation on a Production environment.
{% endhint %}
```
macaw infra stop --service --remove-container
```
Run the below commands to start/stop cfxDimensions infrastructure services.
```
macaw infra start
macaw infra stop
```
Run the below commands to start/stop/restart a specific cfxDimensions infrastructure service.
```
macaw infra start --service
macaw infra stop --service
macaw infra restart --service
```
###
# macaw platform
## cfxDimensions Platform services management:
'**macaw platform**' command is used to deploy and manage cfxDimensions platform services. Run the below command to view available CLI options.
```
macaw platform --help
usage: platform [--insecure] [-h] [--debug] {} ...
Manage the Macaw Platform
positional arguments:
{} commands
dbinit Initialize the platform database
add-service-host Add extra service vm
resource-profile Manages the resource profile operations
access-key-gen Generate an access-keyfor a user
status Status of the macaw Platform
start Start the macaw Platform Containers
stop Stop the macaw Platform Containers
install Install the macaw platform containers
generate-certs Generate certificates for hosts belonging to this
installation
remove-stopped-containers
Remove platform containers that have exited
rolling-update Upgrade the platform services to a new version
optional arguments:
--insecure Ignore SSL certificate issues when communicating with
various hosts
-h, --help show this help message and exit
--debug Enable debug logs for the CLI operations
```
'**macaw platform install**' command is used to deploy/install cfxDimensions platform services. Run the below command to view the available options.
```
macaw platform install --help
usage: platform install [-h] --tag TAG [--refresh-auth] [--service SERVICES]
optional arguments:
-h, --help show this help message and exit
--tag TAG Tag to be pulled from the Docker registry
--refresh-auth Refresh Authentication to Docker Registry.
--service SERVICES Restrict the scope of the command to specific service
```
Run the below command to initialize **MariaDB database** (MariaDB service was deployed part of [cfxDimensions infrastructure service](/implementer-guide/platform-installation/macaw-cli/macaw-infra-cli) installation). This step is a **pre-requisite** before installing cfxDimensions platform services.
(**Note:** Below shown tag name is a sample for a reference only, for actual tag name, please contact CloudFabrix support/sales team.)
```
macaw platform dbinit --tag macaw-2.2.17
```
Run the below command to deploy all cfxDimensions platform services. (**Note:** Below shown tag name is a sample for a reference only, for actual tag name, please contact CloudFabrix support/sales team.)
```
macaw platform install --tag macaw-2.2.17
```
Run the below command to install a specific cfxDimensions platform service. Below are the supported/available platform services. (**Note:** Below shown tag name is a sample for a reference only, for actual tag, please contact CloudFabrix support/sales team.)
* service-registry
* notification-manager
* identity
* provisioner
* user-preferences
* locker
* console-ui
```
macaw platform install --service service-registry --tag macaw-2.2.17
```
**Upgrading the cfxDimensions platform services:** Run the below command to upgrade all platform services. (**Note:** Below shown tag name is a sample for a reference only, for actual tag, please contact CloudFabrix support/sales team.)
{% hint style="danger" %}
Warning: It is a disruptive operation, please take a full backup of your data before you perform this operation on a Production environment. Also, stop the platform services using '**macaw platform stop**' command first before executing the upgrade command.
{% endhint %}
```
macaw platform rolling-update --tag macaw-2.2.18
```
**Deleting the cfxDimensions platform services:** Run the below command to delete all cfxDimensions platform services.
{% hint style="danger" %}
Warning: It is a disruptive operation, please take a full backup of your data before you perform this operation on a Production environment.
{% endhint %}
```
macaw platform stop --remove-container
```
Run the below command to delete a specific cfxDimensions platform service. Below are the list of platform services.
* service-registry
* notification-manager
* identity
* provisioner
* user-preferences
* locker
* console-ui
{% hint style="danger" %}
Warning: It is a disruptive operation, please take a full backup of your data before you perform this operation on a Production environment.
{% endhint %}
```
macaw platform stop --service --remove-container
```
Run the below commands to start/stop cfxDimensions platform services.
```
macaw platform start
macaw platform stop
```
Run the below commands to start/stop a specific cfxDimensions platform service.
```
macaw platform start --service
macaw platform stop --service
```
**Delete older or previous version of Platform Service:** Run the below command to clean up the platform service images.
```
macaw platform remove-stopped-containers
```
####
**Generate self-signed certificates:** Self-signed certificates are used for cfxDimensions infrastructure, platform services and for macaw CLI as well. This manual step is not usually needed as it will be run automatically during '**macaw setup**' execution.
```
macaw platform generate-certs
```
For additional options, run the below command.
```
macaw platform generate-certs --help
usage: platform generate-certs [-h] [--dir CERT_ROOT_DIR] [--overwrite]
optional arguments:
-h, --help show this help message and exit
--dir CERT_ROOT_DIR The directory where the certificates will be generated
--overwrite Overwrite the certificates if they already exist
```
### Accessing cfxDimensions Platform APIs from CLI:
Macaw CLI provides an ability to call cfxDimensions Platform service APIs which allows user to query/configure/update/provision/de-provision application services. It is also used to execute any automated scripts if/when needed.
Below step is a pre-requisite to execute API calls from CLI.
Run the below command to generate an API key for Platform admin user and the generated key is stored inside **platform.cfg** file which will be used while making API calls from CLI.
{% hint style="info" %}
Use --insecure option as shown below when the cfxDimensions platform is NOT deployed with CA signed certificates. --insecure option works with self-signed certificates which are installed by default during cfxDimensions platform setup and configuration.
{% endhint %}
```
macaw platform --insecure access-key-gen --user admin@cloudfabrix.com --password macaw1234 --store-config
```
```
macaw platform access-key-gen --help
usage: macaw platform access-key-gen [-h] [--debug] --user USER --password
PASSWORD [--store-config]
optional arguments:
-h, --help show this help message and exit
--debug Enable debug logs
--user USER User for whom the access-key is to be generated
--password PASSWORD Password to use for login during access-key generation
--store-config Store the generated access key into the platform
configuration
```
###
###
# macaw user
## cfxDimensions Platform user maintenance operations:
'**macaw user**' command is used to change or reset platform admin user's password. Run the below command to view available CLI options.
```
macaw user --help
usage: user [--insecure] [-h] [--debug]
{list-roles,change-password,reset-password} ...
Manage users in the platform
positional arguments:
{list-roles,change-password,reset-password}
list-roles List the roles of an user
change-password Change user's password
optional arguments:
--insecure Ignore SSL certificate issues when communicating with
various hosts
-h, --help show this help message and exit
--debug Enable debug logs for the CLI operations
```
'**macaw user change-password**' to change platform admin user's password to a new one.
```
macaw user --insecure change-password --user admin@cloudfabrix.com
```
'**macaw user reset-password**' to rest platform admin user's password. This option can be used when platform admin's user password is lost or forgotten.
```
macaw user --insecure reset-password --user admin@cloudfabrix.com
```
{% hint style="warning" %}
**Caution:** Since above macaw CLI option allows to rest the platform admin's user password, it is important to make sure to have a strong password set for '**macaw**' user (and also limit the SSH access remotely).
{% endhint %}
# macaw application
## cfxDimensions Platform Application Management:
**macaw application** command provides very comprehensive CLI options to view, provision, de-provision or delete, start or stop application services. Additionally, it allows user to invoke application APIs using this command line. This provides an ability to create automated scripts to provision, de-provision or upgrade application services using Macaw CLI interface.
Below step is a pre-requisite to use **macaw application** and to execute API calls using CLI.
Run the below command to generate an API key for Platform admin user and the generated API key is stored inside **platform.cfg** file which will be used while making API calls from CLI.
{% hint style="info" %}
Use **--insecure** option as shown below when the cfxDimensions platform is NOT deployed with CA signed certificates. **--insecure** option works with self-signed certificates which are installed by default during cfxDimensions platform setup and configuration.
{% endhint %}
```
macaw platform --insecure access-key-gen --user admin@cloudfabrix.com --password macaw1234 --store-config
```
```
macaw platform access-key-gen --help
usage: macaw platform access-key-gen [-h] [--debug] --user USER --password
PASSWORD [--store-config]
optional arguments:
-h, --help show this help message and exit
--debug Enable debug logs
--user USER User for whom the access-key is to be generated
--password PASSWORD Password to use for login during access-key generation
--store-config Store the generated access key into the platform
configuration
```
Below command lists the available published catalog of application blue-prints for cfxDimensions platform.
```
macaw application --insecure catalog
```

The available application blue-prints for cfxDimensions platform is categorized into 'Groups'. Below are available groups.
* Production
* QA
* Demo (Deprecated)
* Datasets (Deprecated)
* Individual Services (Deprecated)
{% hint style="info" %}
For production deployments, user need to pick the catalog of application blue-prints from Production group. QA group is primarily used for Demos, Release Candidate version or POCs
{% endhint %}
Below command lists the Production group catalog which has currently available GA (general available) releases for cfxAIA, cfxOIA, cfxGenie and cfxPulse (deprecated) applications.
```
macaw application --insecure catalog --group Production
```

To list the configuration properties of a published blue-print of an application (cfxAIA, cfxOIA, cfxGenie and cfxPulse (deprecated)), execute the below command. It requires blue-print id as an input which can be obtained from above command. (**macaw application --insecure catalog**)
```
macaw application --insecure show-blueprint
```

Below command shows, currently deployed cfxDimensions applications and their status. It includes application ID, blue-print name, application service name & status and on which service node it is running etc...
```
macaw application --insecure status
```
When multiple cfxDimensions applications are installed, below command can be used to view specific application information. It requires application id as an argument which can be found in '**macaw application status**' command output.
```
macaw application --insecure status --app-id
```

Below commands can be used to stop or start a specific application service. (It requires application id as an argument which can be found in '**macaw application status**' command output.)
```
macaw application --insecure stop
macaw application --insecure start
```
Below command provide configuration information of a currently deployed cfxDimensions applications. It requires application ID as an argument to show the configuration. (Please refer '**macaw application status'** command output.)
```
macaw application --insecure show-config
```

To delete/un-install a deployed cfxDimensions application, below command can be executed.
{% hint style="danger" %}
**macaw application delete** CLI operation is a disruptive operation. It is recommended to take full system backup in Production environment before this command can be executed.
{% endhint %}
```
macaw application --insecure delete
```
# macaw status
## cfxDimensions services operational management:
macaw CLI provides option to view currently deployed cfxDimensions services (Infra, Platform and Application Services)
```
macaw status
```
Run the below command to view currently deployed cfxDimensions infrastructure services.
```
macaw infra status
```
Run the below command to view currently deployed cfxDimensions platform services.
```
macaw platform status
```
Run the below command to view currently deployed cfxDimensions applications services.
```
macaw services status
```
Run the below command to view additional options or help
```
macaw status --help
macaw platform status --help
macaw services status --help
```
# macaw services
## cfxDimensions Application services operational management:
**macaw services** command allows the macaw user to view, start, stop and delete the application services.
Run the below command to view all of the running application services on cfxDimensions platform.
```
macaw services status
```

Run the below commands to stop/start all of the cfxDimensions application services.
```
macaw services stop
macaw services start
```
If user wants to delete all of the cfxDimensions application services, run the '**macaw services stop --remove-container**' command to stop and delete all of them. After running this command, user will not be able to access cfxAIA / cfxOIA or other cfxDimensions applications as it deletes all of them.
{% hint style="danger" %}
**macaw services stop --remove-container** is a disruptive operation and it is recommended to take full system backup before running this command in a Production environment.
{% endhint %}
```
macaw services stop --remove-container
```
# macaw clambda
## cfxDimensions cLambda node management:
Run '**macaw clambda --help**' command to list/view cfxDimensions cLambda node management CLI options
```
macaw clambda --help
usage: clambda [--insecure] [-h] [--debug] {list,list-containers,add-host} ...
Manage CLambda container runtime
positional arguments:
{list,list-containers,add-host}
list List CLambda Hosts
list-containers View the status of CLambda containers
add-host Add a new CLambda host
optional arguments:
--insecure Ignore SSL certificate issues when communicating with
various hosts
-h, --help show this help message and exit
--debug Enable debug logs for the CLI operations
```
Run the below command to **list** currently configured **cLambda nodes**.
```
macaw clambda list
```
Run the below command to '**add a new cLambda node**' to cfxDimensions platform.
```
macaw clambda add-host --host
```
# macaw techsupport
## cfxDimensions Platform Technical Support logs:
**macaw techsupport** is used to collect cfxDimensions platform and application services logs for troubleshooting or debugging any functional issues. CloudFabrix support team requests the user to run this command to collect the logs and provide for any root cause analysis.
```
macaw techsupport --help
usage: techsupport [--insecure] [-h] [--debug] [--host HOST]
[--service SERVICES]
Manage techsupport of macaw
optional arguments:
--insecure Ignore SSL certificate issues when communicating with
various hosts
-h, --help show this help message and exit
--debug Enable debug logs for the CLI operations
--host HOST Host from which the support data needs to be collected
--service SERVICES Collect tech support data only for the specific
component
```
When **macaw techsupport** is executed without any arguments, it collects the support logs of of infrastructure and platform services. Once collected, the logs are stored under '**/opt/macaw-platform-\/support/**' directory.
```
macaw techsupport
```

Additional to infrastructure and platform service logs, to collect application service logs, run the below command with **--host \** option. This command need to be repeated based on number of service nodes are deployed to collect all application services logs. Once collected, the logs are stored under '**/opt/macaw-platform-\/support/\**' directory.
```
macaw techsupport --host 10.95.125.123
```

If you need to collect logs from a specific service node, run the below command with service container id.
{% hint style="info" %}
You can get container id of an infrastructure, platform or application service from '**macaw service**' command output
{% endhint %}
```
macaw techsupport --host 10.95.125.123 --cid 7046f15085e0
```
In order to collect memory dump of an application service, run the below command.
```
macaw techsupport --host 10.95.125.123 --cid 7046f15085e0 --memory
```
In order to collect memory dump of a platform service, run the below command.
```
macaw techsupport --cid 49ea2d5b18a5 --memory
```
# macaw backup
## cfxDimensions Platform Backup Operations:
**macaw backup** command provides option allows cfxDimensions admin user to create backups for platform configuration and application data backup (MariaDB database and Minio data) on-demand or periodically using a cron job schedule.
```
macaw backup --help
usage: backup [--insecure] [-h] [--debug] --dest-dir BACKUP_DEST_DIR
[--create-tar] [--service SERVICES]
Backup the Macaw platform
optional arguments:
--insecure Ignore SSL certificate issues when communicating with
various hosts
-h, --help show this help message and exit
--debug Enable debug logs for the CLI operations
--dest-dir BACKUP_DEST_DIR
Directory into which the backup will be stored
--create-tar Creates a tar file for the backed up data
--service SERVICES Backup only the specified components
```
{% hint style="info" %}
**Note-1:** One of the pre-requisite is to provide a network shared mount point (NFS) to both Platform and Infrastructure services nodes on which Gluster, MariaDB and Minio services are running. It is going to be used to store backup data of cfxDimensions platform.
{% endhint %}
{% hint style="warning" %}
**Note-2:** Though macaw CLI takes backup of platform's configuration and application data, it does not take backup of the OS (RHEL / CentOS) on which the cfxDimensions platform is deployed. It is recommended to use 3rd party tools like veeam, HP dataprotect, cohesity, netbackup etc. to take full VM level backup on periodic basis.
3rd party VM level backup need to be used to recover one of the cfxDimensions platform VMs if OS is unable to boot RHEL / CentOS.
{% endhint %}
Below command takes full backup of platform configuration and application data.
```
macaw backup --dest-dir
```
Inside the backup directory, a folder is created with a date, for example:- ‘2021-07-17-1626586567.934014’ for each successfully completed backup. Inside this directory, the folder structure appears like below:
* data (directory)
* install-root (directory)
* macaw-backup.cfg - Backup configuration file
* platform.cfg - cfxDimensions platform's configuration file
The MariaDB database and Minio object storage data is stored under ‘**data**’ directory.
The other **install-root** directory contains all the necessary configuration files required for each platform and infrastructure services.
**Backup Schedule:**
To take cfxDimensions platform's and application configuration and data backup regularly, it can be scheduled using crond service. Below is one sample crontab schedule entry for the backup.
```
58 20 * * * /home/macaw/.local/bin/macaw backup --debug --dest-dir /cfx-nfs-backup >> /opt/macaw/shared/log/cfx-backup.log
```
# macaw restore
## cfxDimensions Platform Restore Operations:
**macaw restore** command allows to restore previous state of cfxDimensions Platform configuration and application data from the backup which was taken using '[**macaw backup**](/implementer-guide/platform-installation/macaw-cli/macaw-cli-backup)' command.
```
macaw restore --help
usage: restore [--insecure] [-h] [--debug] [--no-prompt] [--service SERVICES]
(--from-dir BACKUP_SRC_DIR | --from-tar BACKUP_SRC_TAR)
Restore the Macaw platform from a previously backed up state
optional arguments:
--insecure Ignore SSL certificate issues when communicating with
various hosts
-h, --help show this help message and exit
--debug Enable debug logs for the CLI operations
--no-prompt Don't prompt for inputs
--service SERVICES Restore only the specified components
--from-dir BACKUP_SRC_DIR
The directory which contains the backed up
installation state
--from-tar BACKUP_SRC_TAR
The tar.gz file which contains the backed up
installation state
```
**Restore cfxDimensions Platform's Configuration and Application data:**
Run the below command to restore from the backup which was taken before.
```
macaw restore --no-promt --from-dir
```
{% hint style="danger" %}
**macaw restore** is a disruptive operation. Before it is executed, please stop all of the platform and application services. For MariaDB restore to work, make sure the MariaDB service is in stopped state. For Minio data to be restored, the Minio service should be up and running.
{% endhint %}
```
macaw services stop
macaw platform stop
macaw infra stop
macaw infra start --service minio
```
After backup is restored successfully, restart the Infrastructure, Platform and Application services using the below commands
```
macaw infra start
macaw platform start
macaw services start
```
# macaw reset
## cfxDimensions Platform factory reset:
**macaw reset** command allows the user to reset the cfxDimensions platform configuration by performing the below operations.
* Stop cfxDimensions application, platform & infrastructure services
* Delete cfxDimensions application, platform & infrastructure services and its data
* Delete all pre-launched containers on cLambda nodes
* Delete all Docker images and volumes on Platform, Service and cLambda nodes
* Delete cfxDimensions platform configuration
{% hint style="danger" %}
**macaw reset** command is a disruptive operation as it clears entire cfxDimensions platform footprint. It's primary purpose is to use only in Demo or POC environments ("**NOT**" in Production) where it requires to re-install entire cfxDimensions platform from scratch.
{% endhint %}
```
macaw reset
```
After executing the above command, user need to re-configure and [install cfxDimensions platform](/implementer-guide/platform-installation).
# Release Notes
Release Notes
# cfxDimensions v2.0.3
Release Date: June 3, 2020
### cfxDimensions Platform Features - v2.0.3
v2.0.3 release is a backward-compatible release. The Platform side of the changes is limited.
The CLI portion of the platform (macawcli) on the other hand, has bug fixes and feature enhancements. In the current v2.0.3 release, the macaw console is hidden from the main landing portals page.
To access macaw console UI, use https\://\/console-ui/
#### Enhancements in CLI
* macaw application --insecure show-config \
* The show-config command will display the configuration details of all the service clusters that belong to an application.
* app-id can be queried/taken from ‘the macaw application --insecure status’ command (this command was released as part of the earlier 2.0.2 macaw platform).
* ‘macaw application status’ command now optionally takes an app-id, to display the status of the user-selected app (or specific user application in context )
* macaw application --insecure status \[--app-id APPID]
* macaw application --insecure invoke --service SERVICE\_NAME --api API\_NAME \[--params-file API\_PARAMS\_FILE | --params PARAMS] appid
* Invoke command allows users to invoke service APIs from the command line. This command is the API browser invocation equivalent in the CLI.
* \--service is the service name and --api is the API to be executed
* appid is the application id in which this service is present. appid can be queried/taken from ‘macaw application --insecure status’ command.
* Parameters to this API can be passed in two ways
* \--params :- Parameters to the above API are passed as a string, representing a JSON array. The following examples provide macaw invocations using --params option.
1\) macaw application --insecure invoke --service dataset-manager --api getDatasetsById --params '\["345849ce-b052-47c4-9fa8-9e898ce351b5"]' 2c10c02-7ca7-41d1-9a74-ee74202a56cf
2\) macaw application --insecure invoke --service cfxdimensions-app-resource-manager --api invokeAppApi --params '\["getUserDetailsById","{\\"userId\\":\\"\\"}"]' a2c10c02-7ca7-41d1-9a74-ee74202a56cf
3\) macaw application --insecure invoke --service dataset-manager --api getDatasetsByCriteria --params '\[{"conditions": \[{"condition-name":"first","type":"IN","attribute":"markers","values": \["replacementProjection"]}],"max-results":10,"results-offset":0}]' a2c10c02-7ca7-41d1-9a74-ee74202a56cf
* \--params-file :- Above parameters to the RPC can be passed through the JSON file too. This option gives the path to a file, containing a JSON array of
parameters that will be passed as parameters to the API invocation
1\) Sample using params-file:-
macaw application --insecure invoke --service dataset-manager --api getDatasetsById --params-file p5.json a2c10c02-7ca7-41d1-9a74-ee74202a56cf
2\) Sample parameter JSON file:-
\[
{
"conditions": \[
{
"condition-name": "first",
"type": "IN",
"attribute": "markers",
"values": \[
"replacementProjection"
]
}
],
"max-results": 10,
"results-offset": 0
}
]
* The output of "macaw application status" has been enhanced to make it much more meaningful.
* macaw application --insecure show-blueprint \
* Will show the contents of a blueprint on the CLI. It gives the blueprint json as output.
* \--exclude in ‘macaw application provision’ command
* Support has been added to exclude certain components from the blueprint during "macaw application provision".In 2.0.2 platform, only include was functional.
* We can exclude services, webapps, generic containers.
* Sample command to exclude email-service.
macaw application --insecure provision --tag AIA-i-4.0.0 --blueprint 9597fbc9-34f2-4e88-a9f3-d799d7ae9ff0 --input config2\_AIA.json --exclude email-service
### Bug Fixes:
* The macaw application stop now stops even generic containers that are part of the application.
* The output of the macaw application start and stop is now consistent and will show the shorter version of the container ids being started/stopped.
* Generic containers that are part of an application can now be successfully provisioned from the CLI and the containers come up without any errors.
* cLambda service when provisioned from the CLI wasn't previously starting in 2.0.2 macaw. This has now been fixed.
* macaw application provision command will now show a better error message if the input JSON file (containing the provisioning input) has invalid JSON content.
* macaw application provision command will now show a better error message if the quantity selected for the blueprint component(s) doesn't fall in the range of allowed min/max quantity defined in the blueprint.
* Identity service seed data has been fixed to not include some random phone number of seeded users. Note that this change can/will only be visible for new installations, when the DB is freshly seeded.
* Minio directories are now cleaned up during macaw reset. Previously if the minio was installed on a separate VM, the cleanup of these directories was not happening. This has been fixed.
* The macaw application stop will now stop the application containers in the reverse order of what's defined in the blueprint of the application. In previous verisons, it was wrongly stopping in the same order as the order defined in the blueprint.
* macaw services delete command was previously deleting all containers (including infra containers), if Infra, Platform, Services are on Platform VM itself. This has now been fixed and the command will delete only service containers.
* The --clean option of ‘macaw platform dbinit’ is fixed. After deleting services, platform containers, users can use dbinit --clean to clear all the service databases from MySQL. It also cleans previous service entries from registry tables.
# cfxDimensions v2.1.17
Macaw Platform - v2.1.17
Release Date: July 15, 2021
### cfxDimensions Platform Features - v2.1.17
v2.1.17 release is a backward-compatible release with the previous release v2.1.16.
### New Features in v2.1.17
#### macaw backup/restore
* \--service option is added to macaw backup and restore commands
* Infra and platform components like ‘Mariadb’, ‘Minio’, ‘provisioner’ options can be used for --service to take backup or restore selected components
* Backup
* Mariadb - mariadb backup is performed on /var/mysql, mariadb-config folders Minio - minio backup is performed on minio data buckets
* All other components, backup is performed from /opt/macaw folders
* Sample commands for reference
* macaw backup --debug --dest-dir /cfx-backup --service mariadb > dbbackup.log
* macaw restore --debug --from-dir /cfx-backup/\ --service minio --no-prompt > minrestore.log
* Backup and restore of Kafka-zookeeper components have been removed from this release
* Backup and restore have been removed for the following platform features - log folders and clambda execution folders, and repository directories.
* Earlier versions based backup-restore used to create an extra database like ‘#mysql50#mariadb-backup’ in the Mariadb. This has been fixed in the current release
For more details on backup-restore, please refer to the following documentation link: \
\
**macaw techsupport \[--host \]**
In this release, additional gluster commands are introduced in the current release for gluster container operations in both HA and standalone setups.
* macaw gluster \[ --debug ] install --tag \
This command is used to install gluster containers. During initial macaw setup, gluster containers are automatically installed by the ‘macaw setup’ command. This command is added to help users during upgrades
* macaw gluster \[ --debug ] stop \[ --remove-container ]\
This command is used to stop all gluster containers. \
*Note: As gluster is used a infra component to share filesystem across the cfxDimensions platform, If users stop gluster containers, the /opt/macaw/shared volume will not be accessible, so do not perform this operation unless needed or only during gluster upgrades.*
* macaw gluster \[ --debug ] start\
To start all gluster containers
* macaw gluster \[ --debug ] status\
To check the status of all gluster containers
* macaw gluster \[ --debug ] remove-stopped-containers \
To remove all the stopped gluster containers
**Additional enhancements as part of this release**
* Log rotation is added for gluster logs (for log file size is 50M)
* KeepAlived system-service status is added to macaw infra status and macaw status CLI
* CLI history is captured to /home/macaw/.macawcli/macawcli.log
**CFDs**
* Copyright Year in tomcat launchpad and in console-ui ‘About’ page was 2020. It is not changed to ‘2021’
* Counts Issue in Main Dashboard of console-ui is fixed
* Service provisioner mismatch counts
# cfxDimensions v2.2.20
Macaw Platform - v2.2.20
Release Date: August 26, 2021
### cfxDimensions Platform Features - v2.2.20
v2.2.20 release is a backward-compatible release with the previous releases v2.1.18, v2.1.17.
### New Features in v2.2.20
#### macaw CLI history
* This release adds functionality to keep a history of user-executed macaw CLI commands in the /home/macaw/.macawcli file.
#### **macaw application --insecure start \**
* This release adds functionality/command that will start all the clusters pertaining to an application in the order which was provisioned using the CloudFabrix application blueprint (services were initially deployed using a standard CloudFabrix application template/blueprint)
#### **macaw application --insecure rolling-update --tag \ \[--input INPUT\_FILE] \[--deployment-flavor DEPLOYMENT\_FLAVOR] \[--wait ROLLING\_UPDATE\_COMPLETION\_TIMEOUT] < app-id>**
* This command can be used to perform a rolling update on all clusters of an application (e.g.cfxOIA), from CLI.
* app**-**id is the id of the application which we can get from the ‘macaw application --insecure status’ command.
* If a user wants to change service-configs of any cluster, then input files can be used to give modified configs. These are the same values that are seen in console-ui during deployment/rolling-update. If there are no config changes during rolling-update, then we can skip the input json file. Service-id, config names can be taken from the blueprint json file.
* \--deployment parameter\
If a user wants to change the deployment flavor, then users can use --deployment flavor. This is an optional parameter.
* \--wait parameter\
\--wait is optional. This parameter provides the number of seconds for the command to wait after triggering the rolling update. During this time, if the provisioner completes the upgrade, then the command will return a success message. This optional parameter is useful when a user prefers to use this command in a script.
#### **Service Provisioner enhancement**
* After the rolling update operation is performed, users no longer see old clusters in the Inactive tab (via console-ui and are now are hidden) When a user performs rolling updates, the system now considers/selects the exact count of instances from the actual instance (provisioned) count. If scale-up/scale-down operation was performed by the user to a service cluster after initial provisioning, then this new count will be considered for rolling-update.
**CFDs**
* Service Registry bug fix to connect back to the MariaDB automatically when it loses connectivity during runtime (intermittently Service Registry disconnects with the MariaDB database)
* The issue with paused cluster instance - Rolling Update on clusters with multiple Unreachable/Registered instances, is leaving one paused instance in the old cluster (MACAW-3583).
# cfxDimensions Backup & Restore
How to backup and restore cfxdimensions platform and application data
cfxDimensions platform holds the configuration and application data within different components of the platform. It is very important to take both configuration and application data on periodic basis to recover the platform should there be a need.
Below are the primary components in which both configuration and application data is stored.
* **Configuration data:** Platform setup and configuration data is stored on the OS filesystem and GlusterFS shared filesystem
* **Platform & Application Data:** Both platform's and application data stored within MariaDB database and Minio Object storage
CloudFabrix provides [macaw CLI](/implementer-guide/platform-installation/macaw-cli) option to take platform's configuration and application data on periodic basis.
{% hint style="warning" %}
Though macaw CLI takes backup of platform's configuration and application data, it does not take backup of the OS (RHEL / CentOS) on which the cfxDimensions platform is deployed. It is recommended to use 3rd party tools like veeam, HP dataprotect, cohesity, netbackup etc. to take full VM level backup on periodic basis.
{% endhint %}
{% hint style="warning" %}
3rd party VM level backup need to be used to recover one of the cfxDimensions platform VMs if OS is unable to boot RHEL / CentOS.
{% endhint %}
For cfxDimensions platform's configuration and application data backup, it is a pre-requisite to mount an NFS volume on both platform and infrastrucuture / database nodes. It is used to store the backup data and for restore using macaw CLI tool.
# cfxOIA Installation
This section covers provisioning of cfxOIA service after the cfxDimensions platform is installed / provisioned.
**Step 1**: Login to cfxDimensions console at https\://\/console-ui.

Enter the platform username and password and click 'Login'.
**Step 2**: You will be logged in Macaw DevOps Console.

**Step 3**: Click on Platform Menu (Top Left) and expand the 'Service Manager'. Select the Service Catalog option from the pull-down menu as shown below.

**Step 4**: You will be in the Service Catalog view. Please choose the right repo from the dropdown (if more than one option available - this will by default point to production entry in a fresh deployment).
Select **cfxOIA Standalone App** and click on 'Deploy'.\
Note: Before selecting the 'Deploy' option, cfxOIA application services require additional properties that are explained in the following sections. Input the necessary options and select 'Deploy'.

Step 5: The next series of views capture various information. In this series of views, you can update the various policies including High Availability, Environment Capability like initial log file size, etc. The following are some of the screen captures along with example properties filled in as per your deployment. Please contact the CloudFabrix support team if you need more information on any particular section of deployment capture views.
**a. Service Information**:
Select which project needs deployment to which environment

{% hint style="danger" %}
Do not select 'Delete Service Metadata unless you are sure of what you are deleting. It is mainly used to delete existing service metadata so that the installation is a fresh start. Always check with the CloudFabrix support team before proceeding further when this needs to be selected. By default, this is unselected.
{% endhint %}
**b. Policies**:
Policies capture high availability information including any environment add-on features like logging, debugging, etc. that need to be enabled during cfxOIA application services deployment.

By default, select 'Best Effort' as an HA deployment policy and choose if any additional environment capabilities required.
**c. Deploy Service**
Select the number of instances for each of the individual services within cfxOIA. Leave defaults wherever applicable for a fresh deployment. Also, you need to select the image tag that needs to be deployed as shown (The production tag will be provided by your point of contact or check with CloudFabrix support).

**d.Email Service**
Email service enables default SMTP for email communication with your users like when they forgot a password, etc.

**e. Indigo Reporting Service**
Enter Mysql DB details to be used by reporting services. These are the same properties that users provided during the OVF VM macaw setup (by default you can choose Platform Infra based MySql that was deployed on your Platform VM along with its properties that user has provided).

**f. cLambda Service**
Enter the tag of cLambda container. The default value is python2.7.

**g. Dataset Manager**
Enter MYSQL details to be used for datasets including the connection pool details.

**h. Inframanager Service**
Select the number of Protowraps per protocol in the environment. The default is 4.

**i. CFX Scheduler Service**
Enter the prefix you want to use for each of the scheduler jobs. The default value is oia.

**j. IRM Service**
Enter CFX Dimensions app IRM service database details including the incident processor frequency for pending incidents. This is the same Mysql details that were deployed on Platform.

**k. Plugin Execution Service**
CloudFabrix provides certain functionality as python packages which can be configured here so that is provisioned as part of service deployment.
Check with CloudFabrix support for plugin details including its content or leave them blank.

**l. Alert Ingester**
Enter the details provided by CloudFabrix or leave them blank.

**m. Event Consumer**
Enter the details provided by CloudFabrix or leave them blank.

**Step 6**: Once all the details are entered, click on 'Verify'. Once verified and click on 'Deploy'.
**Step 7**: Verify if the deployment is successful by ensuring that all services are running without errors. Users can verify this from the console UI home screen as shown below.
From the home screen of cfxDimensions / Macaw Console UI, the dashboard page provides the information. The dashboard view as shown below displays all the services and application services that are deployed to the cfxDimensions platform.

From Service Groups and Applications view, click on cfxOIA Standalone App.

This leads to cfxOIA Standalone App service status page as shown below. Make sure the service instances status shows 'Available.

# cfxOIA Application Services
Operations Intelligence & Analytics
CloudFabrix Operations Intelligence & Analytics application is a core component of AIOps solution. It provides some of the below primary functions but not limted to.
* Alert source integrations
* Alert enrichment, correlation and suppression
* Incident Room for incident management
* Machine Learning for Alert/Incident Clustering, Regression and Classification
* Ticketing Integration
* Alert Analytics
* Incident Analytics
Below is the list of services that are included part of cfxOIA application (AIOps) deployment.
| **cfxOIA Application Service Name** | **Description** | **Deployment Requirement** |
| ----------------------------------- | ----------------------------------------------------------------------------------------------------------------------------------------------------------------------------------------------------------------------------------------------------------------------------------------------------------------------------------------------------------------------------------------------------------------------------------------------------------------------- | -------------------------- |
| **email-service** | Email service is used to export and share the reports or dashboards with users through email. | Optional |
| **cfx-schedule-service** | Scheduler service is used to schedule different types of jobs, some of them are ML training, CMDB / Inventory data updates, and internal application jobs. | Mandatory |
| **clambda-service** | cLambda is a serverless function service that is used for on-demand job execution. | Mandatory |
| **dataset-manager-service** | Dataset manager service is to provide management function to deal with datasets for reporting and analytics (Deprecated) | Optional |
| **reporting-service** | It is used to export the reports shown in the UI. Some of the example reports are Alerts / Incidents data. | Mandatory |
| **safebox-service** | It is used as a secure password store which consists of credentials for different data sources/endpoints. Other application services query safebox service for respective credentials during runtime on-demand | Mandatory |
| **workflow-manager-service** | It is used for workflow lifecycle management and supports calling different types of automated workflows for running ML experiments, incidents data generation, and other data collection. | Mandatory |
| **active-alerts-caas** | It is used as a caching service for current alerts (up to 3 days, with 60 seconds refresh rate) in a data frame and provides faster data access to the reports within the Alert management UI | Mandatory |
| **all-alerts-caas** | It is used as a caching service for all alerts (current & historical, with 60 minutes refresh rate) in a data frame and provides faster data access to the reports within the Alert management UI | Mandatory |
| **asset-identity-service** | This service is primarily used to maintain the metadata/identity of MSP & Customer/Organization level information. | Mandatory |
| **cfx-connectors-service** | This service is used to load all of the necessary Minio buckets during the initial start-up. These Minio buckets will be used by different services like alert ingester, CaaS, cfxdx, and other services. | Mandatory |
| **cfx-app-controller** | This service is to load all of the UI reports like Application icons, Projects, and dashboard after the user's login. | Mandatory |
| **app-access-manager** | It is used to impose RBAC based user roles & permissions | Mandatory |
| **app-notification-service** | It is used to manage internal application notifications from various application services and pop them up in UI as notification events. | Mandatory |
| **app-resource-manager** | It is used to provide user management and roles and it works with app-access-manager service | Mandatory |
| **app-file-browser** | It is used to provide a user interface in UI to store/upload and query/download the data files. It uses Minio object storage in the back-end to store all of the data files. Additionally, it is used by other application services. | Mandatory |
| **app-irmconfiguration** | This service is used to load all of the configuration pages in UI like Alerts/Incidents/cfxdx sources etc.. an example, configuration operations like create/update/delete webhooks for incoming alerts/incident updates and other operations under Project's configuration. | Mandatory |
| **reports-registry** | It is used to load all of the reports in the UI | Mandatory |
| **app-app-builder** | This service is used to build new reports pages or update existing analytical reports based on the user's requirement | Mandatory |
| **datasources** | It is used to provide a data source integration feature to add/edit/delete for different data source connectors (Deprecated, it will be removed in future releases) | Mandatory |
| **app-irm\_service** | This service provides incident lifecycle management, like open, update, and close incidents automatically after alerts are processed successfully. | Mandatory |
| **app-collaboration** | This service is used to configure and integrate different collaboration technologies likes Microsoft teams, ServiceNow, Slack & Pagerduty, etc. | Mandatory |
| **plugin-execution-service** | This service provides back-end support to Datasources services while integrating with external data sources like ServiceNow, VMware vROps, VMware vCenter, Microsoft Teams, and Pagerduty (Deprecated, it will be removed in future releases) | Mandatory |
| **alert-processor** | This service process persists alerts and their state transitions. It manages the lifecycle of alert policies. It correlates/suppresses alerts based on the defined policies. It also forwards the active alerts for incident creation. Alerts are consumed via notification from the alert ingester service. | Mandatory |
| **app-alert-ingester** | It processes incoming events/alerts from external sources. alerts/events are first mapped into a concrete event - alert/incident/message. Once the mapping is complete, the alerts/events are classified using an ML clustering algorithm (if applicable) and enriched by processing them through an enrichment pipeline comprising a sequence of enrichment steps. The enriched alerts/events are then published for further processing by the alert-processor service | Mandatory |
| **app-event-consumer** | This service is used to listen to or poll events from an external source on-demand / runtime or by schedule. Some of the example events are alerts/incidents/messages from an external source into the cfxOIA system for further processing. | Mandatory |
| **app-ml-config** | This service manages all of the Machine Learning (ML) lifecycle management operations like create, update, execute, activate, delete experiments, etc(for Alert/Incident Clustering and Regression). | Mandatory |
| **app-iddiscovery** | This service discovers unique asset information based on refresh interval by asset IP address from alerts table. | Mandatory |
| **app-smtp-server** | This service is used to ingest alerts from different monitoring tools which send email-based alert notifications. | Optional |
| **webhook-server** | This service is used to ingest alerts from different monitoring tools which send alert notifications over HTTP(s) protocol (Webhook) using POST or PUT operations. | Mandatory |
| **app-cfxdx-service** | This service is used to integrate with many external data sources like ServiceNow, VMware vROps, VMware vCenter, Nagios, PRTG, Splunk, Elasticsearch, etc to query the inventory, logs, metrics data, transform them using native data management pipelines and consume them for Alert / Incident data enrichment for correlation, noise reduction and for probable root cause recommendations | Mandatory |
| **streaming-worker-manager** | This service is used to launch the streaming micro-services on demand and execute streaming jobs for incidents | Mandatory |
| **ingestion-tracker** | This service is used to track all incoming alerts/events into the cfxOIA system and report their state transition status throughout their lifecycle. | Mandatory |
# cfxOIA Release Notes
# cfxOIA v5.1.5
CloudFabrix cfxOIA v5.1.5 Release Notes - July 18th 2021
## New Features
### **HA Support**
This release supports Out-of-the-box HA capabilities to cfxOIA.
### **Alert noise reduction**
Support for alert noise reduction by integrating with 3rd party tools via Webhooks, Email, and CSV.
* AppDynamics
* Nagios
* PRTG
* Zabbix
* Grafana
* vROps
* Dynatrace
* Datadog
* Node ping
* Ops manager
* AWS Cloudwatch
* Prometheus
* Email alerts
### **Alert Tracking**
Track all incoming alerts coming from different sources to OIA
### **Incident room**
* Incident tracking after alert noise reduction
* Support for bidirectional integration with ServiceNow, PagerDuty, JIRA Service Desk, JIRA
* Triage incidents by integrating with collaboration tools Slack, MSTEAMS
* Support to create manual incidents
### **Inbuilt RDA Integration**
* Out-of-the-box support for Nagios, vROps, ServiceNow integration
* Support for creating and scheduling pipelines
* Support for enrichment attributes
### **Machine Learning(ML)**
* Support for ML clustering experiments to identify symptom clusters via historical alerts, incidents
* Support for Alerts and Incidents prediction after activating experiments
* Support for forecast analysis by running regression experiments
* Support for scheduling experiments
## **CFD’S - Resolved**
**CFXOIA-134** - Cluster label not updating in the incident report if update cluster labels in view clusters report
**CFXOIA-143** - Bulk clear alerts not working properly
**CFXOIA-144** -- Correlation policy with higher precedence not working until restart alert processor RDA Pipeline schedule jobs getting failed few times randomly
## **Known Issues & Workarounds**
# cfxOIA v5.1.5.2
CloudFabrix cfxOIA v5.1.5.2 Release Notes - Sep 13th 2021
## New Features
1. LIcense file upload from UI
2. Included Alert deduplication as part of Alert noise reduction
3. Mapping Wizard changes
4. UI support to add enriched attributes in Correlation Policy and Alert Report
5. Ability to add enrichment attributes to Alerts report filtering
6. Alert trail report enhancements
7. DNS resolution enrichment
8. Additional Alert clustering prediction metric/score in Alerts table
9. Enhanced cluster mapping
10. Added new administration role (MSP Admin)
11. Precedence changes in correlation and suppression policies
12. Support for Python virtual-environment for each event-consumer
## **CFD’S - Resolved**
* **CFXOIA-189:** Bulk clear alerts not working properly
* **CFXOIA-41:**Having issues on mapping wizard while doing back and forth operations
* **CFXOIA-135:**Need option to disable the auto-refresh for the tabular report on UI if needed
# cfxOIA v5.1.5.3
CloudFabrix cfxOIA v5.1.5.3 Release Notes - Sep 27th 2021
## New Features
1. Added License report to the Platform Admin and MSP Admin users
2. Added original enrichment attribute in 'Enriched Attributes' report as read-only
3. Create/Edit operations added to MSP functionality from M\&U App for the Platform Admin user
## **CFD’S - Resolved**
* **CFXOIA-247:** Correlation Policy is not getting assigned for alerts based on the precedence after updating precedence of policy precedence.
# cfxOIA v6.0.0
# cfxOIA v6.1.0
CloudFabrix cfxOIA v6.1.0 Release Notes - Jan 24th 2022
## New Features
* New "Message' attribute is added in filter builder for correlation and suppression policies
* Optimization changes in the Ingestion tracker component
* Introduced RDA/Pipeline based job execution instead of cLambda jobs for Asset Saver, Observations, Attachment generation as part of incident generation component
* Topology optimization changes
* ServiceDeskplus integration via RDA
* Optimization in event consumer component
* Added customer as a quick filter in Alerts Reports
* Added Customer name as additional attribute in APM and Ops manager mapper
# Incident Management
Incidents page view display all the incidents created and allows to view by source, filter results by priority, state, category, etc.
{% content-ref url="/pages/-MB\_MIlEHWhjFXPUROyL" %}
[Incidents Overview](/features-guide/incidents/incidents-overview)
{% endcontent-ref %}
{% content-ref url="/pages/-MB\_NQmOEG0ZsgHNDBMp" %}
[Create Incident](/features-guide/incidents/create-incident)
{% endcontent-ref %}
{% content-ref url="/pages/-MB\_S7sVOBFAUcWmsn9V" %}
[Incident States](/features-guide/incidents/incident-states)
{% endcontent-ref %}
{% content-ref url="/pages/-MB\_T50-wZZiD5Aa7swl" %}
[Accessing Incident](/features-guide/incidents/access-incident)
{% endcontent-ref %}
{% content-ref url="/pages/-MBB3LxNUe0RZPHIA2c7" %}
[Filters Management](/ui-and-portal-features-guide/filters)
{% endcontent-ref %}
# Incidents Overview
Once a user logs into the project, the Incidents page is displayed (as shown in below screen capture).


The above image shows the Incident's main view. The main parts of the page view are as follows (which are captured below using respective numbers from the above screen capture).
1. **Project Bar** - Displays Project Name, Project Owner, etc.
2. **Filter by Major Criteria** - Filters the results by major criteria like Age, Assigned To, Priority, etc. The multi-level filtering could be applied on results in combination with other filters. This view can be minimized to get more space on the incident's main page.
3. **Filter by search string** - Allows filtering by the search string.
4. **Filter by Age** - Apply filters by age (by hours, by days, etc). The multi-level filtering could be applied on results in combination with other filters.
5. **Filter by Values** - Apply filters by selecting values from the drop-down for Priority, Assigned To, State, Category, Starred. The multi-level filtering could be applied on results in combination with other filters.
6. **Incidents View Menu** - This field allows search on incidents, get quick insights, create a new incident or on context menu toggling the view (for example tabular) and also, allows to export or choose the fields that need to be displayed
7. **Incidents** - Incidents in normal textual format or tabular format (as shown above)
8. **Incident Context Menu** - At each incident, there is a context menu to perform various actions on the selected incident - Update Incident Status, View Incident Details, Update incident, Refresh ingested data, Add to Starred, etc. so that they can be easily viewed from the Starred selection as shown in #5 (Filter by Values) and to archive the incident.
9. **Notification Bar** - This section is normally minimized. The notification bar displays project-wide notifications by expanding the notification view to the left (select the notification bar to view system-wide notifications).
**Columns On Tabular View**:
| Column Name | Description |
| ------------------------ | ------------------------------------------- |
| Incident ID | Incident Number |
| Summary | Summary of Incident |
| Priority | Priority of Incident |
| Source | Source System where the alert was generated |
| Created | Incident Created Date |
| Updated | Incident Last Updated Date |
| Age | Time since the ticket created |
| Category | Category of Incident |
| Type | Type of Incident |
| Assigned To | Whom the incident is assigned to |
| Configuration Items | Configuration Items |
| Resolved By | The user resolved the incident |
| CFX State | State (specified by CloudFabrix) |
| Room ID | Room ID |
| Customer ID | Customer ID |
| CFX Job Submitted Time | CFX Job Submitted Time |
| CFX Job Last Update Time | CFX Job Last Update Time |
| Label | Label |
| Description | Description |
| Reported By | Reported By |
| Created By | Created By |
| Closed By | Close By |
| Comments | Comments |
| Source Key | Source Key |
| CFX Incident Occurred | CFX Incident Occured |
| Data Updated | Data Updated |
| Archived | Archived |
| Favorite | Favorite |
| Correlation Id | Correlation Id |
| Service Names | Service Names |
| Tags | Tags |
# Create Incident
To manually create a new incident, click on the ‘Add New Incident’ and' Add New Incident' view is as displayed below.

As shown above in the above screen capture,
1. Select Incident Category from the drop-down - Host Configuration, Host General, Knowledgebase, Network Device or Network Device Upgrade or other relevant categories (as configured)
2. Enter a summary for the incident - Describes how the summary follows a particular pattern while entering the text. The sample texts are shown below. One needs to get a good understanding of what to enter in the summary.
3. Chose Incident occurred todate and time.
Click 'Save'.
{% hint style="info" %}
The following are some of the summary descriptions for users to try to get familiar with how to enter descriptions.
Replace IP Address, Place, Device Model, and Version from the following examples.
**Knowledgebase:**
tac case# 12345697 tac case# 12345678 may be fn70816 also see Cisco-SA-20150916-CVE-2015-6295
\
**Network Device :**
Device 192.168.216.21 has issues during upgrade - may be related to field notice 64180
Device 192.168.216.18 has issues related to bug CSCus36208
Device 192.168.5.56 has OSPF issues during the upgrade, opened tac case# 12345678
Network upgrade:
Upgrade devices in city 'Pleasanton'
Upgrade devices in city 'Greenwood Village'
Upgrade devices with OS Version '7.1(4)N1(1)'
Upgrade devices in city 'Walnut Creek'
Upgrade devices in city 'Pleasanton' and model 'N9K-C93180YC-EX-B' and OS Version '7.0(3)I7(4)'
Upgrade devices impacted by bug 'CSCvo59504' and OS Version '16.6.5'
Upgrade devices impacted by bug CSCvo59504 and model 'WS-C3850-48P-L' and model 'WS-C3850-48T-L'
Upgrade devices in city 'Walnut Creek' and model 'WS-C3850-48P-L' and OS Version '16.6.5'
{% endhint %}
# Incident States
There are various states an incident resides after an incident is created. The state defines the current state of the incident.
{% hint style="info" %}
The following incident states are as defined by CloudFabrix. However, ITSM tools may use similar names/terminology for different purposes.
{% endhint %}
1. Starred - It is to store incidents like favorites so that a user can easily access incidents (more frequently used incidents).
2. To do - It is the first state of an incident that it will be in when an incident is created
3. Analyzing - It is the state where an incident is ingesting data from data-sources.
4. Review - Once the data analysis completed, the incident automatically moves to a Review state so that users can start working on the incident.
5. Failed - In case if the system comes across any issue during the analysis phase, the incident will be in the Failed state. The user needs to check and take corrective action on this incident or on the data analysis.
6. Archived - All the archived incidents reside here before they are purged and deleted by the defined purge configuration.
7. Throttled - During the creation of an incident, when there are more incidents created than defined in a particular time or if a job is taking more time to pull the relevant data while creating the incident, these incidents are moved into the Throttled state. The user needs to check and rerun the jobs so that the incident will move into To do -> Analyzing -> Review.
# Accessing Incident
By clicking on the Incident number, the user can navigate to view the incident details.
The following screen capture shows a sample incident details page along with an explanation of the functionality available in OIA system.


**Note**: Each bulleted number refers to the numbers captured in the above screen shot referring to the functionality of the OIA.
1. **Left Side Page Menu** (Tabs): User will be able to navigate to various functionality on the incident and each of the selected incidents contains additional functionality (drill-down functionality).
2. **Stack** : Based on type of incident for example, Infra, Application, etc, the stack shows related information. The above incident shows a sample view where there is an issue with networking there by showing only the information from Host, Virtualization, Storage and Network. The above images show different Incident Views for different incident types. The stacks are configured as part of project configuration.
3. **Incident Details**: Displays the incident details either in textual or tabular format. One can always change the type of view displayed.
4. **Incident Context Menu**: Context menu on incident allows to choose the columns that needs to be displayed on the view. Also allows to export all/current pages in CSV, XLS and PDF formats.
5. **Incident Overview**: Displays the incident summary
6. **Favorite Incidents**: By clicking star, the incident can be added as favorite or remove it from favorites. This allows the user to revisit the incident easily from the main Incidents View.
7. **Page Menu**: The page menu available as part of Incident top bar (Incident Overview) allows various actions on incident - including 'Update Incident State', 'Update Incident', 'Update Data' and Archive.
8. More.. By clicking More, the user can view Incident details in summarized view (shown as pop-up). A sample screen below shows the details using More and top incident bar.

You can click on an incident number to navigate into the incident to view the details about the incident including the stack, collaboration teams, Remediation, Attachments, activities, etc. Click on the following links to learn more about each of functionality.
{% content-ref url="/pages/-MBmjj2TeTqjJ33OhIHw" %}
[Stack](/features-guide/incidents/access-incident/stack)
{% endcontent-ref %}
{% content-ref url="/pages/-MBmjlVodoPgSAgSvTlH" %}
[Alerts](/features-guide/incidents/access-incident/alerts)
{% endcontent-ref %}
{% content-ref url="/pages/-MBmjnEKwqJHqmDs05u\_" %}
[Metrics & Logs](/features-guide/incidents/access-incident/metrics-and-logs)
{% endcontent-ref %}
{% content-ref url="/pages/-MBmjpICGJppPOcmPPsz" %}
[Insights](/features-guide/incidents/access-incident/insights)
{% endcontent-ref %}
{% content-ref url="/pages/-MBmjxizPqVg2oP3Pycn" %}
[Collaboration](/features-guide/incidents/access-incident/collaboration)
{% endcontent-ref %}
{% content-ref url="/pages/-MBmk-J8StO2gLXVh53L" %}
[Diagnostics](/features-guide/incidents/access-incident/diagnostics)
{% endcontent-ref %}
{% content-ref url="/pages/-MBmk39MKZwNZhmn0PS8" %}
[Remediation](/features-guide/incidents/access-incident/remediation)
{% endcontent-ref %}
{% content-ref url="/pages/-MBmk70Gs1Jl91xPw85S" %}
[Attachments](/features-guide/incidents/access-incident/attachments)
{% endcontent-ref %}
{% content-ref url="/pages/-MBmkA7ltAmA6pIoemq8" %}
[Activities](/features-guide/incidents/access-incident/activities)
{% endcontent-ref %}
# Stack
A stack is a logical term that combines related services/applications. A stack view provides what is happening at related services/applications so that the user has the knowledge in resolving the incident. A sample Stack view is as displayed before an application.

As shown above, a user can gain knowledge of what is happening at other related services/applications. for example, Database service. By clicking on other layers, the user will be able to get detailed information from within the stack.
# Alerts
Alert View as part of the Incident shows the alert associated with the incident.

1. **Incident Overview**: Displays Incident overview
2. **More**: By clicking/selecting the 'More' option provided, a pop-up view will provide summarized information like Priority, Source, etc.
3. **Incident Page Menu**: In this section, one can save the incident as a favorite by clicking on the page menu. Users can update the incident state, incident, data refresh, and/or archive the incident.
4. **Details**: This option shows alert information. The table (Table1) below gives all the columns available for selection while displaying the alert.
5. **Alert Context Menu**: By clicking on the context (hamburger) menu, users can clear alert or they can view enriched attributes. Also, users can view the source of the alert.
6. **Alert Export Menu:** The context (hamburger) menu at Alert title level allows the user to export the alerts or to select (user selected) columns to display. Here, the user can also choose to maximize and get the alert details in a maximized view.
| Column Name | Description |
| ---------------- | ----------- |
| Raised At | |
| Severity Label | |
| Message | |
| Asset Name | |
| Component Name | |
| status | |
| Customer Label | |
| Stack | |
| Layer | |
| Alert Category | |
| Alert Type | |
| Component Type | |
| Asset Type | |
| Asset IPAddress | |
| Source Mechanism | |
| Source | |
| Repeat Count | |
| Rule Name | |
| Created By | |
| Updated By | |
| Created At | |
| Updated At | |
| Notes | |
| Attributes | |
| Cluster | |
| Alert ID | |
| Rule Id | |
| Asset ID | |
| Environment ID | |
| Component ID | |
| Project ID | |
| Customer ID | |
| Severity | |
| | |
# Metrics & Logs
Metrics and Logs are the information ingested from various services/applications. It automatically pulls all the relevant metrics, KPIs, and logs and is shown/displayed in a single pane of observability view.
### Reviewing Metrics

1. **Incident Overview**: Incident overview like other views, stays at the top of the screen (Metrics & Logs screen capture)
2. **Stack**: Stack provides detailed information on related services/applications at the time of the incident.
3. **Pre-Defined Filters**: Allows users to view the Metrics & Logs by applying various policies like Correlation, Anamoly, Reviewing logs, etc.
4. **Details**: The details view provides a graphical representation of metrics and logs collected at the time of the incident. The user can choose a specific time in any of the sub-views and in-turn, all the other related views will reflect the period chosen providing the user with the right information. The user can select one of the buttons (for example on) Anomalies, 'High' and 'No Anomalies', the display changes to reflect the selected functionality (based on the selected button).
5. **Status**: Provides status for each of the sub-areas.
### Reviewing Logs
The following screen capture shows a view of all the logs collected from different sources at the time of the incident or when a user chooses a particular time from the Metrics graphical view.

### Reviewing Root Cause Inference
This view provides anomalies, noticeable changes so that the incident reason could be drilled down to make root cause analysis.


# Insights
Insights provides information into how similar incident in the past was resolved and who resolved it.
From Incident page menu (left navigation), select Insights.

### Similar Incidents
Similar Incidents displays incidents previously happened. It shows both opened incidents and resolved incidents in this category. This gives vital information to you about similar incidents and how they were resolved. You can navigate to the previous incidents (as example Opened) as follows.

### Resolution Code
Resolution Code provides vital information on how the previous incidents were resolved. For example, the previous incidents shown above were resolved by increasing resources. This provides insight into how you can resolve the existing incident.

### Resolved User
In some of the incidents, it is essential to know who actually resolved the incident. This helps you either to discuss the information with respective user or to assign to the right resource so that the incident is resolved in an efficient way.

# Collaboration
Collaboration Page View provides space to exchange incident details with other teams. The communication is bi-directional.
{% hint style="info" %}
The administrator will configure necessary collaboration channels like MS-Teams, Slack, etc. related to the project.
{% endhint %}
The following view displays a sample collaboration view.

Some of the third party collaboration tools integration is discussed at the following links. A Project administrator will be able to configure these and other collaboration channels.
{% content-ref url="/pages/-MB5s8gfa5wwMFgPB5m-" %}
[Microsoft Teams](/integrations-guide/integrations/ms-teams)
{% endcontent-ref %}
{% content-ref url="/pages/-MB5rxmJwL67vLOpL5cr" %}
[Slack](/integrations-guide/integrations/slack)
{% endcontent-ref %}
# Diagnostics
Diagnostics allows to run some of the pre-defined diagnostics such as IP Ping, etc. Cloudfabrix allows integration of existing diagnostic tools thereby allowing users to execute the commands.
There are two main views - Diagnostic Tools and Tools Run History.
### Diagnostic Tools
Diagnostic Tools allows to run commands on the assets for example if the asset is reachable or not using IP Ping, etc.

### Tools Run History
Tools Run History provides history of commands run using Diagnostic tools including execution time, execution status, return output, etc.

# Remediation
Remediation allows to execute configured remedial tools so that necessary actions can be taken like restarting a server or clearing up a log, to name a few . The Remediation page has two main views - Remedial Tools and Tool Run History.
You can navigate from Incident and then selecting 'Remediation' on left side page menu as shown below.

### Remedial Tools
Remedial Tools are either commands or integrated 3rd party tools which can perform certain pre-defined actions on assets. The following image captures the flow to execute 'Clearing Logs' on a server.

### Tool Run History
Tool Run History view captures the logs of all remedial actions taken in previous step.

# Attachments
Attachements provides all the reports generated and available for downloads. A sample Attachments page is as displayed below.

To download attachment, click on context (hamburger) menu of the report and click on 'Download' as shown below.

# Activities
Activities shows all the activities like data ingestion and their status. A sample Activity page view is as displayed below.

In order to find what happened to a particular status like 'Failed', user can access related logs by clicking on context menu (hamburger menu) of the activity and selecting View Logs and sample log file is as shown below.

# Incident Actions
There are various actions you can perform on an incident. The following screen captures the navigation and below are each of the action.

### Update Incident State:
By selecting 'Update Incident State', you can change Target State and Priority. Also You can assign the incident to different user.

As shown above, you can choose target state, priority and user from drop down menu and click 'Assign' to assign new state.
### Incident Details:
Incident Details takes you to [Incident Page View](/features-guide/incidents/incidents-overview).
### Update Incident
Update Incident allows to modify any of the incident details. By clicking 'Update Incident', the following view allows you to modify the information previously entered or automatically generated from alerts

### Update Data:
Update data regenerates the data for the incident. Click on 'Update' to regenerate incident data.

### Remove From Starred:
Starred allows to quickly access the incidents allowing you revisit and resolve at later time. By clicking Remove From Starred, the incident is remove from the starred state.
### Manage Enrichment and Metrics:
By clicking on 'Manage Enrichment and Metrics, you are navigated to Manage Metrics Page View.

### Archive
By clicking archive, the incident is archived.
### Resolve Incident
Resolve Incident is part of the ['Update Incident State](/features-guide/incidents/untitled#update-incident-state)' . Select Target State as 'Resolved' and the view expands to capture Resolution code, details etc.

Click on 'Resolve' moves the incident status to resolved.
# Alert Management
**Navigation**: Once you have logged in, select OIA Application and chose the the project. In the project home page, select Alerts from left side menu.
Alerts display all the active alerts, cleared alerts and analytics.
{% content-ref url="/pages/-MBtUkTHnmDTlpGMk9MX" %}
[Alerts Overview](/features-guide/alert-watch/alerts-overview)
{% endcontent-ref %}
{% content-ref url="/pages/-MBtUtEfOx2Kv8QnOWHF" %}
[Broken mention](broken://pages/-MBtUtEfOx2Kv8QnOWHF)
{% endcontent-ref %}
{% content-ref url="/pages/-MBtUyJgRfn4hl8H1QKb" %}
[Broken mention](broken://pages/-MBtUyJgRfn4hl8H1QKb)
{% endcontent-ref %}
{% content-ref url="/pages/-MBB3LxNUe0RZPHIA2c7" %}
[Filters Management](/ui-and-portal-features-guide/filters)
{% endcontent-ref %}
The home page is as displayed below:
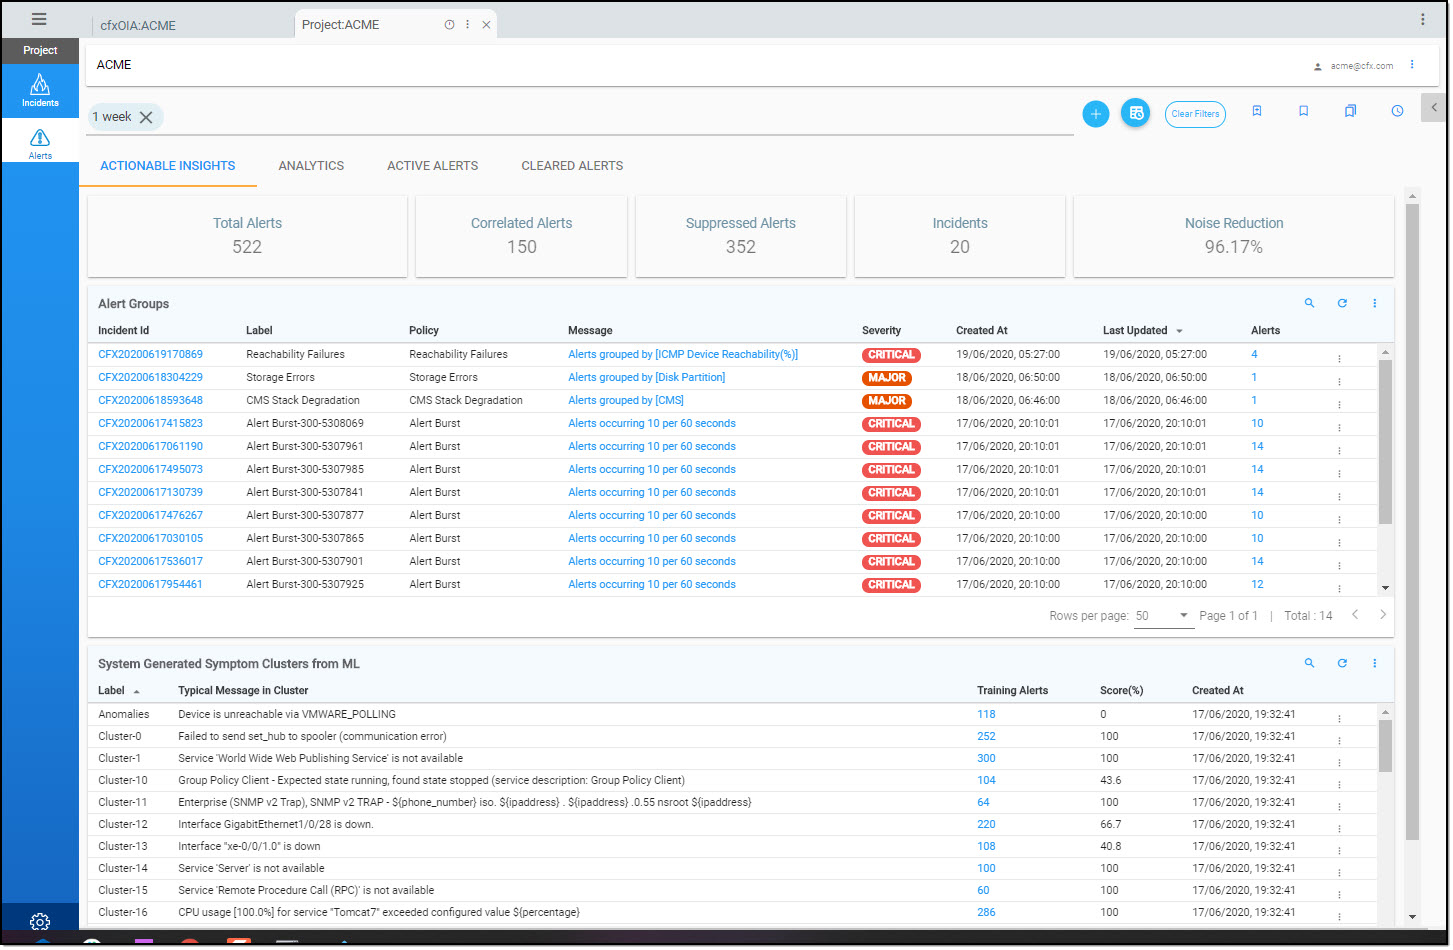
The major functionality available at Alerts are:
1. Actionable Insights, 2) Analytics, 3) Active Alerts and 4) Cleared Alerts
### Actionable Insights:
Actionable insights provide a summary of alerts and how many alerts were correlated and suppressed. It also displays the number of incidents created. A Sample screen is as shown below.

Next to the summary view is Alert Groups. Alert groups display the incidents, the severity, and how many alerts are merged in the incident. A sample screen is displayed.

By clicking on any incident, more information about the incident can be obtained. Once an incident is selected, it opens in a new window with incident related information. At this point of time, it ingests the data and applies the logic. Hence, it takes a while to display. \
The below view under alert groups is Clusters created using Machine Learning (ML). A sample view is as displayed below.
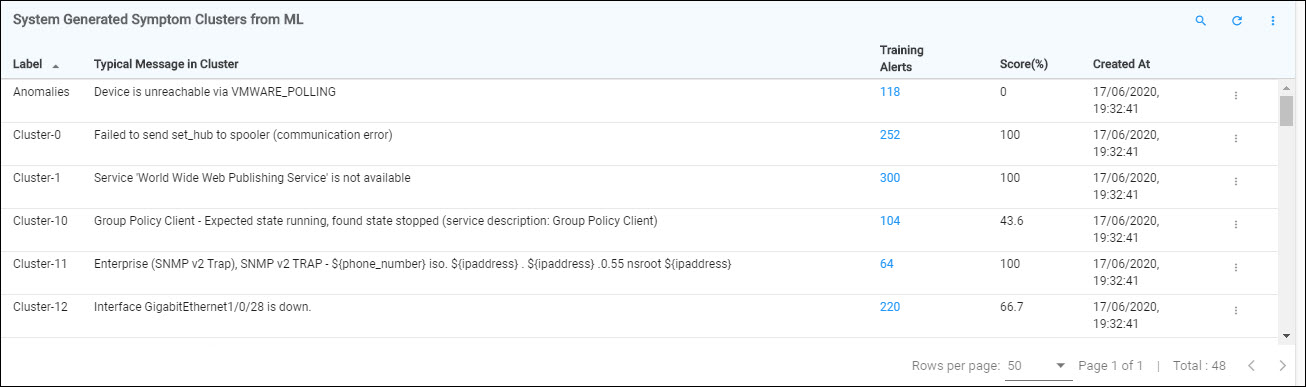
### Analytics
Analytics provides various alert information by alert type, alert source , heat map and correlated alerts. The following provides sample visualizations.
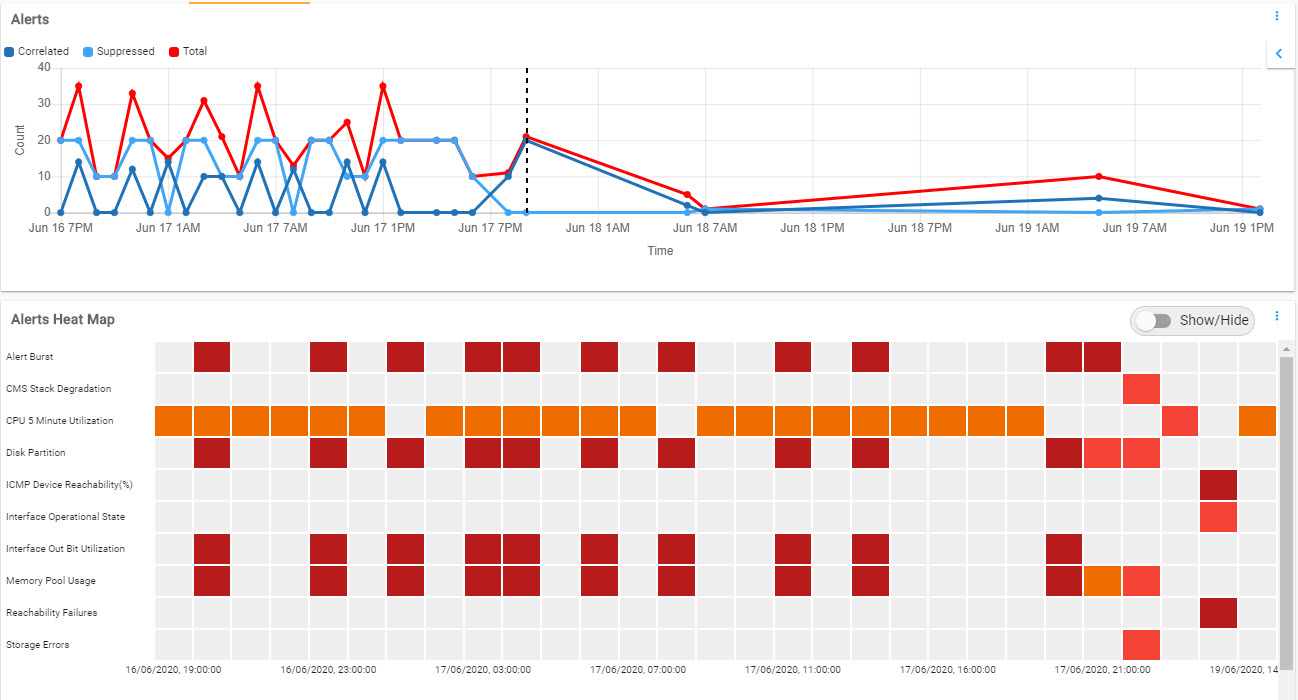
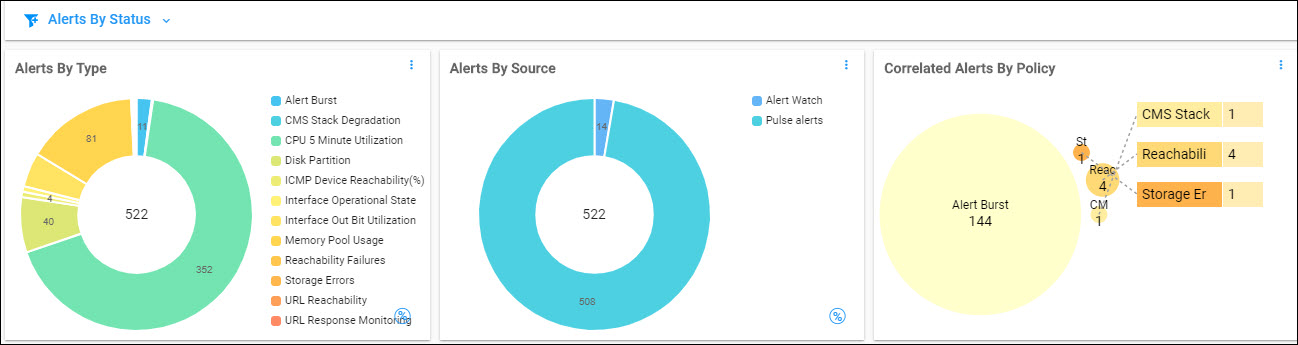
### Active Alerts
Active alerts displays all the alerts which are active or correlated. On any of the alerts, the context menu allows to delve more into the source, additional attributes, or to clear the alert. A visualization is as displayed below.
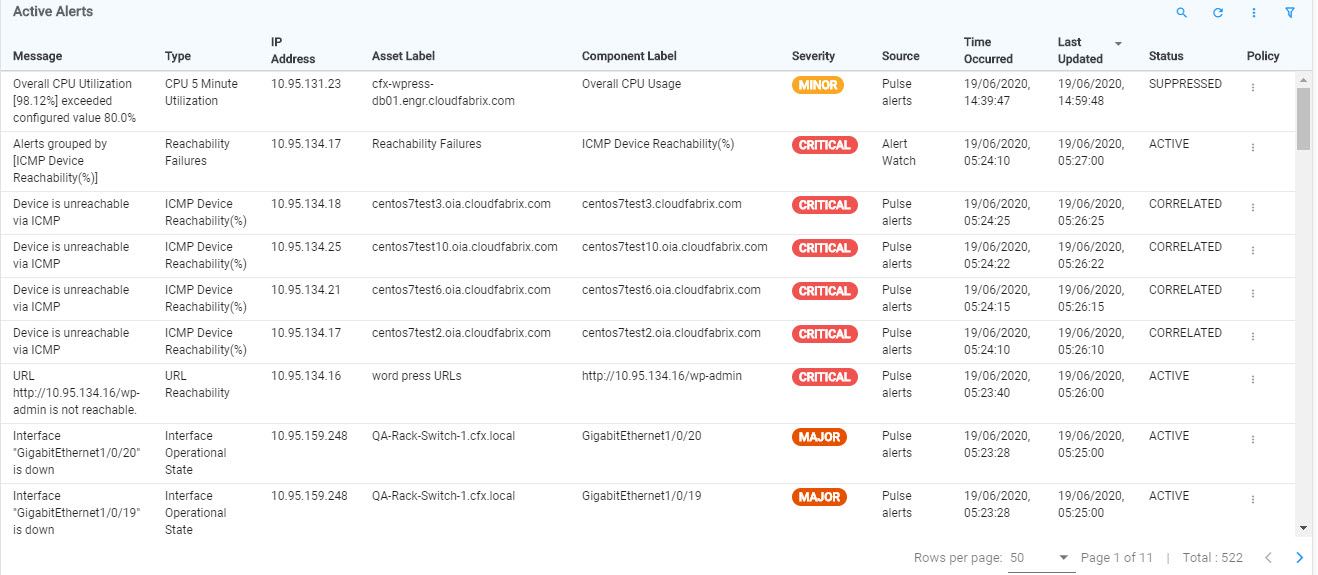
### Cleared Alerts
All cleared alerts are displayed here. A sample visualization is as displayed below.
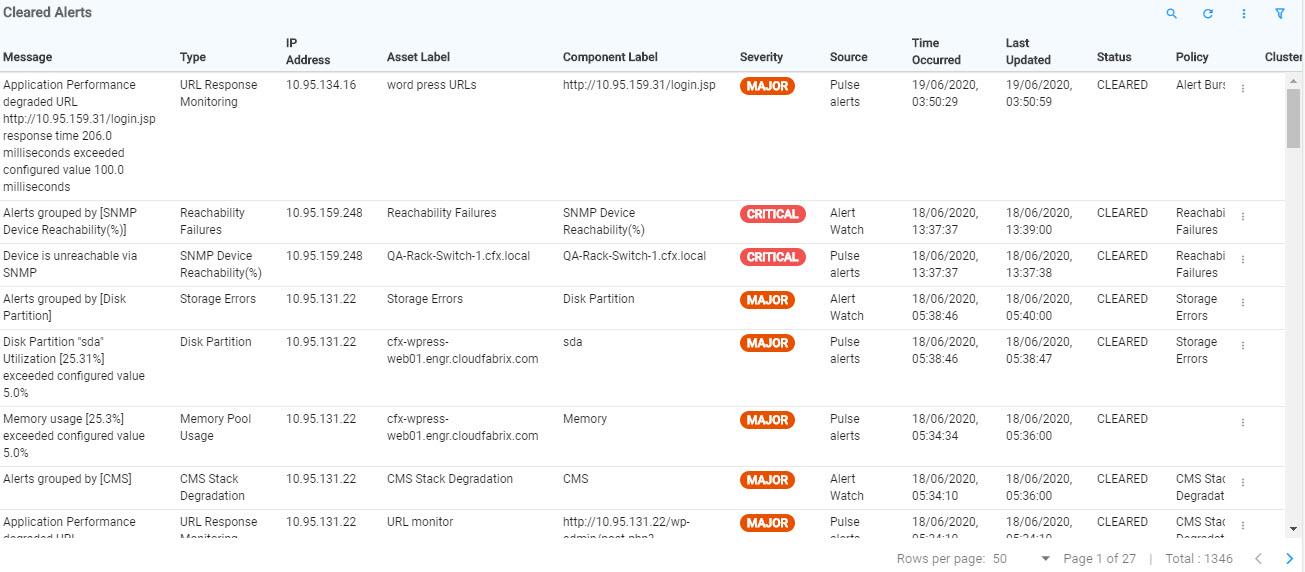
# Alerts Overview
Alerts view, operations and analytics
This section provide details on Alert management, operations and navigating through alerts analytical reports.
Follow the below steps to view the Current Alerts, All Alerts and Alert Analytics pages.


**Current Alerts:**
Active and Cleared Alerts from all alert sources (Ex: Nagios, vROps, CA APM, PRTG, Grafana, Solarwinds, Nodeping etc..) for last 3 days. Current Alerts report refresh time is every 60 seconds.
**All Alerts:**
Active and Cleared Alerts from all sources (Ex: Nagios, vROps, CA APM, PRTG, Grafana, Solarwinds, Nodeping etc..) for last 30/45/60 days depends on the configured alert history retention time. All Alerts report refresh time is every 60 minutes**.**

1. **Filter bar** : Select and apply one or more alert attribute to narrow down the scope of the current or all alerts view. See [Filters ](/ui-and-portal-features-guide/filters#filtering-option-1-top-bar)on how to use it.
2. **Quick Filters:** These are pre-defined filters for ease of use. On click, it drops-down and shows available values and supports selecting one or more attributes.
3. **CFXQL Filter** : CFXQL (CloudFabrix quey language) is to create and apply complex filters. This option is for advanced users. See [CFXQL](https://docs.cloudfabrix.io/cfxql-cfx-query-language) on how to use it.
4. **Time window filter**: Allows user to select a time window, i.e. for last 5 mins / 15 mins / 24 hours / 3 days etc.. which applies the slected time window filter to view current or all alerts.
5. **Filter management**: Provides option to save the filter that is entered in Filter bar for future use. It also provides history of previous applied filters.
6. **Clear Alerts**: Clear one or more alerts.
7. **Quick Insights**: It provides overall insights for alerts by Source, alert type, alert category etc.. against a scale of 100
8. **Alert's view management options**:
1. Maximize Alerts view table
2. Export Alerts table
3. Select Alerts table columns and set the order
9. **Alert operations**:
1. Clear Alert: To clear the 'Active' alert
2. View Enriched Attributes: To view the enriched attributes of the alert
3. View Incident: To view the associated CFX incident of the alert
4. View Source Alert: To view the raw payload of the Alert notification
10. **Alert attributes**
# Alert Analytics
Analytics provides summarizes alerts correlated out of total alerts and how much noise reduction taken place. They also show visual representation of Alerts By Type, By Age, By Source and Correlated alerts by policy as shown below.


# Alert States
The following summarizes various alert status and their meaning.
| Alert Status | Description |
| ------------ | ---------------------------------------------------------------------------- |
| ACTIVE | An actionable alert with a corresponding incident |
| CLEARED | An alert indicating that the issue no longer exists (Cleared) |
| CORRELATED | Alert has been correlated to other alerts and will be part of an Alert Group |
| SUPPRESSED | An alert that is suppressed based on a suppression policy |
# Alert Sources
### **Create Webhook for incoming alerts from different Monitoring Tools:**
**Step 1:** Login to cfxDimensions through web-browser UI (as Project Admin user)

**Step 2:** Click on ‘OIA (Ops Intelligence & Analytics)’ app

**Step 3:** Edit on an existing Project and click on 'Configure Project'

**Step 4:** Click on ‘**Alerts**’ (left menu)
**Step 5:** Under '**Alert Endpoints**' tab, Click on ‘**+**’ button to add a new Alert source

**Step 6:** Select '**Endpoint Role**' as Source
**Step 7:** Enter alert source '**Name**' appropriately based on source Monitoring tool (Ex: Alerts from Zabbix/VMware vROps/AppDynamics/Dyntrace/Solarwinds etc..)

**Step 8:** Enter Description for alert source
**Step 9:** Under '**Event Type**' section, select OIA Alert '**Type**' as shown in the below screen.

**Step 10:** Under '**Endpoint Type**' section, select '**Webhook with Basic Authentication**'

**Step 11:** For '**Hostname or IP address**', enter FQDN DNS Name or IP Address of cfxDimensions platform. This is used within the Webhook URL.
**Step 12:** For 'Timezone' select appropriate timezone of incoming alerts from the selected Monitoring tool type in **Step 9**. (By default, it is set to UTC, which means, it expects the incoming alert timestamp is in UTC)
**Step 13:** Protocol, Port, URI and Security Token are optional and not required
**Step 14:** Enter 'Username' and 'Password' to enable HTTP Basic authentication for Webhook. These are optional settings and leave them empty to disable HTTP Basic authentication.
**Step 15:** Click on '**Save**' to create Webhook based alert endpoint for the alerts.
**Step 16:** Edit the newly created alert endpoint and click on '**Enable**' to activate it.
**Step 17:** Edit the newly created alert endpoint and click on '**Webhook URL**' to view and copy it.
### **Configure Alert Mapping for defined alert sources (Webhook / Email):**
**Step 1:** Click on '**ALERT MAPPINGS**' tab as shown in the below screen to create an Alert mapping configuration for a Webhook or Email based alert source.
Click on '**+**' button.

**Step 2:** Enter the description for the alert mapping (ex: Alert mapping for VMware vROps Production Environment Webhook)
**Step 3:** Select the created Webhook or Email under alert endpoints section which is needed for alert mapping configuration.
**Step 4:** Select '**OIA Alert**' as the target endpoint and click on '**Next**' button.


**Step 5:** Select appropriate mapper from the list based on the alert source. Below are some of the certified mapper configuration for different alert sources.
| **Alert Source** | **Mapper Configuration file** |
| ------------------------------ | ----------------------------- |
| AppDynamics (webhook) | appdynamics\_json.json |
| VMware vROps (webhook) | vmware\_vrop\_json.json |
| Nagios (webhook) | nagios\_json.json |
| PRTG Network Monitor (webhook) | prtg\_json.json |
| Grafana (webhook) | grafana\_json.json |
| Dynatrace (webhook) | dynatrace.py |
| CA APM (email) | caapm\_json.json |
| Solarwinds (webhook) | solarwinds.py |
| Manage Engine OpManager | opmanager.py |

**Step 6:** Select default pipeline as shown in the below screen and click on '**Next**'

**Step 7:** Select '**JSON**' option as showin the below screen. Mapping script allows to tune the alert mapping attributes as needed.
{% hint style="info" %}
Please contact CloudFabrix technical support to modify the alert mapping attributes
{% endhint %}
Under **Test Input** box, a test alert payload can be pasted in JSON format and click on '**Run Test**' to verify the alert mapping configuration.
Click '**Next**' and Click '**Finish**' in the next screen to complete the alert mapping configuration. The above procedure need to be followed for every alert source integration.

Now go to [Featured Integrations](/integrations-guide/integrations)
# Advanced Alert Configuration
Concepts, How it Works, Viewing Alert Groups, Creating/Customizing Policies, Viewing Correlation Recommendations
{% content-ref url="/pages/-MCLukdd4zxj2R5USQbN" %}
[Alert Correlation & Suppression](/features-guide/alert-correlation/alert-correlation)
{% endcontent-ref %}
{% content-ref url="/pages/-MBtxd0YYCMYwHVKPyYM" %}
[Broken mention](broken://pages/-MBtxd0YYCMYwHVKPyYM)
{% endcontent-ref %}
{% content-ref url="/pages/-MCLup\_Ga63QU7KKoq2A" %}
[Broken mention](broken://pages/-MCLup_Ga63QU7KKoq2A)
{% endcontent-ref %}
# Alert Mappings
Alert attribute normalization
Alert notifications are ingested from disparate monitoring tools into CloudFabrix AIOps platform and each of them follow different format with different alert attributes. Some of the below attributes (not limited to) are important ones in general related to any incoming alert.
* Alert Timestamp
* Alert Status
* Alert Severity
* Alert Source
* Alert Message
Below are three sample alert notifications payload from VMware vROps, Nagios & AppDynamics. As shown in the below, the alert attributes are completely different from each other.

In CloudFabrix AIOps platform, it is a prerequisite to normalize these alert attributes coming from different monitoring tool sources to a common data model. Below are list of attributes which are used as part of the alert mapping process. Every ingested alert will go through Alert mapping process and their's payload attributes are mapped to the below standard attributes.
{% hint style="info" %}
Not all below attributes are mandatory to be mapped. The attributes that are flagged with **\*** are mandatory ones.
{% endhint %}
* **alertCategory:** An attribute which can be used to categorize the alert
* **alertType:** An attribute to classify type of alert
* **assetId:** An attribute which can be used to identify the source of alert (Endpoint identity)
* **assetIpAddress:** An attribute that is used to identify the IP Address of the end point
* **assetName\*:** An attribute that is used to identify the AssetName of the end point (ex: Hostname / Devicename)
* **assetType:** An attribute that is used to identify type of the Asset or the end point (ex: VM / Server / Storage / CPU / Memory etc)
* **clearedAt\*:** Alert timestamp that is used to identify when the alert was cleared
* **componentId:** An attribute to associate a sub-component ID of an endpoint from which the alert was generated
* **componentName:** An attribute to associate a sub-component name of an endpoint from which the alert was generated
* **message\*:** Alert message that states the symptom or problem which has caused the alert
* **raisedAt\*:** Alert timestamp that is used to identify when the alert was occured
* **severity\*:** Alert's severity (Ex: Critical, Warning, Minor etc..)
* **status\*:** Alert's state (Open / Closed / Active / Recovered / Cancelled)
* **alertkey\*:** Alert's unique identifier which is used to identify an incoming alert and to apply alert de-duplication process. It can be taken from a single alert attribute or a combination of alert's attributes
**Alert ingestion with alert mapping process (normalization) data flow:**

# Alert Enrichment
How it Works, Viewing Enriched Attributes
## Overview
Raw alert data contains very limited information, often consisting of id, severity, message/description, rule name and asset IP/host name. This information doesn't provide enough service context (application or service name, environment, machine-type etc.) or support ability context (NOC id, site-id, department, support-group etc.) which are essential data for efficient correlation of alerts. OIA performs automated alert data enrichment using a combination of following approaches
* ACE (Automated Context Extraction): Using this method, it extracts useful information like IP Address, DNS name and certain identifyable attributes from the source alert's payload. This doesn't require any external integrations, however, in majority of the scenarios, this may not be sufficient for alert correlation.
* External source lookup: This process looks up information related to the incoming alerts in an external data source (ex: CMDB or Inventory system, CSV etc...) and then adds them as enriched alert attributes. Enriched attributed presents more contextual information to the IT Operations user and also will be used to correlate the alerts.
Below flow illustrates different stages of Alert processing from ingestion, alert attributes mappings, alert enrichment, correlation/suppression and persisting into the system's database.

## Alert attributes enrichment pipelines
Alert enrichment pipeline has two configuration blocks.
1. Querying external datasource (like CMDB, Nagios, vROps etc) and save enriched attributes into a dataset (CSV style table)
2. Define condition(s) or filter(s) rule to lookup, by taking one or more alert’s payload attributes (Ex: assetname / assetipaddress etc) and query additional attributes for a matched record from the saved dataset of an external datasource
{% hint style="info" %}
The alert's payload attributes should be CFX alert attributes which are mapped using alert mapping configuration. For more information, please refer '[Alert Mappings](/features-guide/alert-correlation/alert-mappings)'
{% endhint %}
Below are few key alert attributes which can be used for alert enrichment attributes from the saved dataset that was created from external datasource integration.
* assetName
* assetIpAddress
* componentName
Below screen shows a sample enrichment pipeline extracting additional attributes from 'Nagios' monitoring tool and configuring the system to use it as part of alert enrichment process.

**Enrichment conditions / filters examples:**
In the below example, the saved dataset is from VMware vROps, i.e vrops-resource-properties
As a condition rule, multiple attributes are used for a lookup from the above saved dataset for enriched attributes.
Condition-1: **identifier** == '**$assetId**' ('**identifier**' is a column within the saved dataset from vROps, **$assetId** is the alert attribute which was mapped from the source alert using alert mapping process). Check if '**assetId**' attribute from Alert payload matches '**identifier**' within the saved dataset.
Condition-2: **vmw\_name** == '**$assetName**' ('**vmw\_name**' is a column within the saved dataset from vROps, **$assetName** is the alert attribute which was mapped from the source alert using alert mapping process). Check if '**assetName**' attribute from Alert payload matches '**vmw\_name**' within the saved dataset.
Condition-3: **vmw\_guest\_ipaddress** == '**$assetIpAddress**' ('**vmw\_guest\_ipaddress**' is a column within the saved dataset from vROps, **$assetIpAddress** is the alert attribute which was mapped from the source alert using alert mapping process). Check if '**assetIpAddress**' attribute from Alert payload matches '**vmw\_guest\_ipaddress**' within the saved dataset.
{% hint style="info" %}
Any attribute which is speficied with $ represents alert payload's mapped attribute. For more information, please refer '[Alert Mappings](/features-guide/alert-correlation/alert-mappings)'
{% endhint %}
**enrichcolumns:** vmw\_name, vmw\_parent\_vcenter, vmw\_powerstate, vmw\_accessible\_status
{% hint style="info" %}
When none of the enrich columns are specified, it will fetch all columns that has non-null or empty values as enriched attributes
{% endhint %}
Condition operator for all of the above condition: OR (which means, extract enriched attributes if any of them find a matching record within the saved dataset from vROps
```
- query: datasetname = 'vrops-resource-properties' & condition = "(identifier == '$assetId' or vmw_name == '$assetName' or vmw_guest_ipaddress == '$assetIpAddress')" & enrichcolumns = 'vmw_name,vmw_parent_vcenter,vmw_powerstate,vmw_accessible_status'
```
Below are some of the supported operators which can be used while querying the saved dataset of an external source using conditions.
* \== (equals)
* != (not equals)
* or
* and
## Viewing Alert's enriched attributes
Alert enrichment provides additional context to alerts for effective correlation. The user can view enriched attributes by selecting 'View Enriched Attributes' on context menu of the alert as shown.

# Alert Correlation & Suppression
## Overview
Alert correlation is the process of grouping together related alerts to reduce noise and increase actionability of alerts and events. Correlated alerts are grouped translated to CFX incidents, which are then routed to ITSM systems for handling by NOC/IT Analysts, who can then login to OIA (Operations Intelligence and Analytics) Incident Room module to perform swift triage, diagnosis and root cause analysis of an Incident.
## How it Works/Key Points
* Ingested alerts and events are normalized to OIA alert model, to allow addressing most alerts/tool implementations
* Customers can add custom attributes to alert model using enrichment process
* Ingested alerts are enriched with context about application, stack, department, ownership, support-group etc. using a process called alert enrichment.
* Enriched alerts are then evaluated for any correlation or suppression to be performed. Suppression policies are used to suppress alerts that escape maintenance windows.
* Alerts that remain are then evaluated for correlation that is determined by correlation policies, which are setup in 3-ways
1. **System defined policies**: To address well-known behavior like alert burst and alert flapping situations.
2. **ML driven correlation recommendations**: OIA uses unsupervised ML clustering to detect alert patterns and provides list of suggested correlations in the form of Symptom Clusters.
3. **Admin defined correlation policies:** Administrators can define new correlation policies or customize existing policies to meet their needs. For instance, correlation policies allow admins to group alerts across a full-stack or an application instance. Admins can also group alerts across a common infrastructure (like network, storage etc.) or shared services (ex: SSO, DNS etc.).
### Correlation Policy - How it Works and Key Controls
Correlation policies are in enabled state when created, but can be disabled. Correlation policies determine how alerts can be grouped together. Most of the correlation policies can be created in an assisted-manner by recommendations provided by OIA's correlation engine with symptom clusters.
A correlation policies can result in one or more instances of alert correlations, each represented by an Alert Group
Following controls are available to specify correlation behavior.
### **Minimum Severity of Alert Group:**
Severity of alert group is always determined by the highest severity of alerts that it comprises of. However, if customers want to a certain minimum level of severity to alert groups formed by this correlation policy
### Time Boxing
Time boxing is the concept of grouping related alerts that fall within a certain time window, like 15-mins, 30-mins or 1-hour. The time window is started when first matching alert is detected and closed after the time window expires. Any new matching alert after time window expiration will result in new alert group instance formation and leading to a new incident.
### Precedence
Precedence values help determine which policy takes precedence when conflicts arise, which could arise when an alert matches multiple policies. For example, an alert belonging to symptom cluster "prod" and application "CMS" can match both policies that are setup to correlated alerts at application level (app-name == CMS) or at symptom cluster level (cluster-name == prod). By providing higher precedence to application-level policy, alerts can will be grouped at application level.
Precdence is numeric value, and higher values indicate higher precedence and take priority in case of match. Precedence values are optional, if not provided, system provides Precendence values automatically, based on chronological order i.e newly created correlation policies will get higher precedence.
A typical approach would be setup more wider or broad-scope correlation policies with higher precedence and more specific correlation policies to be with lower precedence.
### Property Filters
Narrows down related alert selection criteria using a set of property filters that match property fields with specified values using conditions like (equals, contains, in list of values etc.)
Property filters allow fine grained control of correlation policies to meet organizational processes, administrative domains or functional groups.
### Group By
Related alerts can be grouped by values in a certain attribute. This works best for attributes that are typically of type enumeration, list of values or represent a limited set of identities.
For example, assume Machine-Type attribute has following values Machine-Type = Application, Server, Network, Storage
then if the Group By selects Machine-Type as attribute, correlation engine will automatically group alerts which have
"Machine-Type == Application" into one group. "Machine-Type == Server" into one group, "Machine-Type == Storage" into another group, "Machine-Type == Network" into another group.
Group By can also use multiple attributes for advanced scenarios to yield more complex situations.
Continuing from same example above, let's add one more attribute and use Group By with two attributes
```
Machine-Type = Application, Server, Network, Storage
Environmnt = Prod, UAT
```
With two group by attribute selections indicated above, following alert group correlations will be
```
"Machine-Type == Application and Environment == Prod" into one group.
"Machine-Type == Application and Environment == UAT" into one group.
"Machine-Type == Server and Environment == Prod" into one group.
"Machine-Type == Server and Environment == UAT" into one group.
"Machine-Type == Storage and Environment == Prod" into one group.
"Machine-Type == Storage and Environment == UAT" into one group.
"Machine-Type == Network and Environment == Prod" into one group.
"Machine-Type == Network and Environment == UAT" into one group.
```
# Creating and Updating Correlation Policies
Correlation policy management
Follow the below steps to view and manage the Alert correlation policies.


### **Correlate Burst policy:**
Follow the below steps to create a '**Correlate Burst**' policy.
Click on '**+**' buton to create a new Correlation policy and select the policy type as '**Correlate Burst**'

As highlighted in the below screen, define the correlation burst policy settings appropriately.
Set correlated alert group’s minimum severity. (**Note:** Incident’s severity is set to highest severity, if one of the grouped alert’s severity is higher than policy’s severity**)**
**Raise Count:** Alert burst count (minimum)
**Raise Rate (seconds):** Rate of Alerts burst count within the defined time (seconds)
**Group Expiry (minutes):** Time window (for how long) to keep this policy active to group the burst of alerts
**Auto clear after last update (minutes):** Clear the Alert automatically after defined time (if there is ‘NO’ clear / recover message for the alert) (Note: when set to ‘0’, alert will be cleared automatically if there is a clear / recover message for the same**)**

As shown in the below screen, Limit the Correlation burst policy scope to specific alert source (Nagios, vROps etc..) or it’s attributes (Site / application name etc.. )
**Group by** '**Attributes**' helps to correlate and group the alerts based on Alert attribute (one or more) selection.

Once the correlation policy is selected, make sure the policy's **Enabled** status is set to '**Yes**'.

### **Correlate Group policy:**
Follow the below steps to create a '**Correlate Group**' policy.
Click on '**+**' buton to create a new Correlation policy and select the policy type as '**Correlate Group**'

As highlighted in the below screen, define the correlation group policy settings appropriately.
Set correlated alert group’s minimum severity. (**Note:** Incident’s severity is set to highest severity, if one of the grouped alert’s severity is higher than policy’s severity**)**
**Group Expiry (minutes):** Time window (for how long) to keep this policy active to group the burst of alerts
**Auto clear after last update (minutes):** Clear the Alert automatically after defined time (if there is ‘NO’ clear / recover message for the alert) (Note: when set to ‘0’, alert will be cleared automatically if there is a clear / recover message for the same**)**

As shown in the below screen, Limit the Correlation burst policy scope to specific alert source (Nagios, vROps etc..) or it’s attributes (Site / application name etc.. )
**Group by** '**Attributes**' helps to correlate and group the alerts based on Alert attribute (one or more) selection.
Click on '**Save**' to create the correlation policy.

Once the correlation policy is selected, make sure the policy's **Enabled** status is set to '**Yes**'.

##
# Creating and Updating Suppression Policies
Suppression policy management
Follow the below steps to view and manage the Alert correlation policies.


### **Suppress policy:**
Follow the below steps to create a '**Suppress**' policy.
Click on '**+**' buton to create a new Suppression policy and select the policy type as '**Suppress**'
**Auto clear after last update (minutes):** Clear the Alert automatically after defined time (if there is ‘**NO**’ clear / recover message for the alert) (Note: when set to ‘0’, alert will be cleared automatically if there is a clear / recover message for the same**)**

As shown in the below screen, Selection Criteria allows to limit the Suppress alerts policy to specific alert source (Nagios, vROps etc..) or it’s attributes (Site / application name / group of assets by asset name or IP address etc.. )
Also, select the Frequncy, to enable Suppression policy during a specific time window, for example, if it is only once or daily or weekly.
Click on '**Save**' to create the suppression policy.

### **Suppress Flapping Alerts policy:**
Follow the below steps to create a '**Suppress Flapping Alerts**' policy.
Click on '**+**' buton to create a new Suppression policy and select the policy type as '**Suppress Flapping Alerts**'
**Flapping Count:** Enter alert flapping count (Alert’s state transition from Active to Clear is considered as one count)
**Flapping Rate Seconds:** Alert flapping count rate within a given duration (in seconds)
**Selection Criteria:** Limit the Suppress Flapping alerts policy to specific alert source (Nagios, vROps etc..) or it’s attributes (Site / application name / group of assets by asset name or IP address etc.. )
Click on '**Save**' to create Suppression policy for Flapping alerts.

Once Suppression policies are created, make sure they are in enabled state.

# Correlation Recommendations
cfxOIA correlation engine can learn and provide new correlation recommendations using unsupervised ML clustering on historical alert data. OIA provides this recommendation in the form of list of problems or symptoms, each identified as a cluster, that are relatable in customer's environment. It also provides a confidence score %, indicating the level of similarity of messages in each cluster and higher the confidence score, more similar the messages are. Admins can run generate the recommendations on-demand by running ML experiments on historical alert data by selecting data from a certain time period, for example during past 3-months or past 6-months. An upcoming feature is to be able to schedule the ML experiments to be run on an periodic or ongoing basis. The way this clustering process works is it first devariablizes i.e takes out all variables, identities etc. from alert data and tries to arrive the core message tha alert represents. For example, if multiple alert messages with
```
user john.doe not able to login to cms1.acme.local
user mark.scott unable to open login into portal cms1.acme.local
user lucy.lu complaining of login failure cms1.acme.local
```
The real issue is with `"unable to login"` and not the user who complained. OIA gets to the real symptom by using devariablization and performing DBSCAN and HDBSCAN clustering algorithms to come up set of a symptoms or problem clusters found in the data.
Administrators can review new clustering recommendations by browsing through list of symptom clusters, select a symptom cluster and create a correlation policy out of the symptom cluster. This process can be repeate for other clusters. Admins can also rename symptom clusters and give an appropriate name to the cluster based on the messages in the clusters. For example, "Device not reachable", "Batch job failure", "Duplicate IP", "Disk Fragmentation high" etc.
# ML Driven Operations
Using ML to perform Correlation Prediction, Seasonality and Anomaly Detection
## Overview
OIA uses machine learning (ML) at its core to intelligently learn patterns from huge volumes of historical as well as streaming data and automate key IT operational activities and decisions at large scale. AIOps admins can execute ML jobs on-demand using any ML pipeline available in the system. OIA's has three out of the box (OOTB) ML pipelines, and all hyper parameter tuning can be performed from UI itself. Advanced customization scenarios allow uploading of new ML pipelines.
## ML driven Alert Correlation
OIA leverage ML to drive majority of alert correlations. OIA detects various alert problems or symptoms in alert or event data and automatically starts correlating future incoming alerts based on these patterns. OIA uses unsupervised machine learning algorithms that remove stop words, identities etc. (de-variablization) and then tries to form clusters based on alert message. OIA also allows AIOps admin to further narrow down scope of alert symptom correlations to a particular application, stack or an infrastructure layer.


## **ML driven Log Clustering**
Efficiently relating and analyzing large volumes of logs is a common challenge for IT operations teams. When an Incident occurs, logs become one of the key sources of triage data. To make it easy to analyze log data, OIA uses clustering algorithms to automatically detect and group all related logs into clusters, and then plot them on a heatmap to indicate the density and occurence windows of log clusters. This will help incident operators to conduct root cause analysis faster.
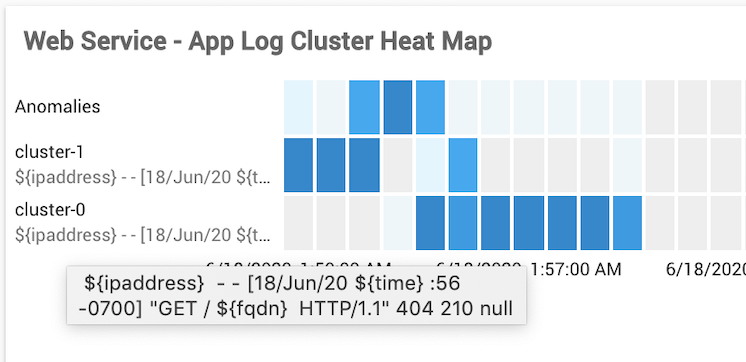
## ML driven Predictions, Seasonality and Anomaly Detection
Prediction insight consists of forecasting alert volume or ingestion rate, providing a perspective into how many alerts Ops team can expect in future. OIA can perform this prediction analysis on multiple dimensions, including alerts coming a certain source, or alerts of certain application, severity, site or even alerts of certain symptom. In addition to prediction insights, OIA also provides seasonality and anomaly detection when ML jobs are run, which can be executed on-demand or scheduled to be run periodically, which helps in continous learning, training and testing of models.


## **ML driven Root Cause Inference - Metrics Anomaly Detection, Noticeable Changes**
OIA dynamically retreives incident-specific performance metrics from multiple monitoring tools as part triage data gathering. This data is typically retrived 20 hours prior to incident occurrence and it keeps retreiving 4 hours after (these values are configurable). In addition to this, OIA also detects local anomalies and noticeable changes by bucketizing data into smaller intervals, like 15 mins, and then performs regression analysis and statistical analysis to figure out anomalies and noticeable changes.
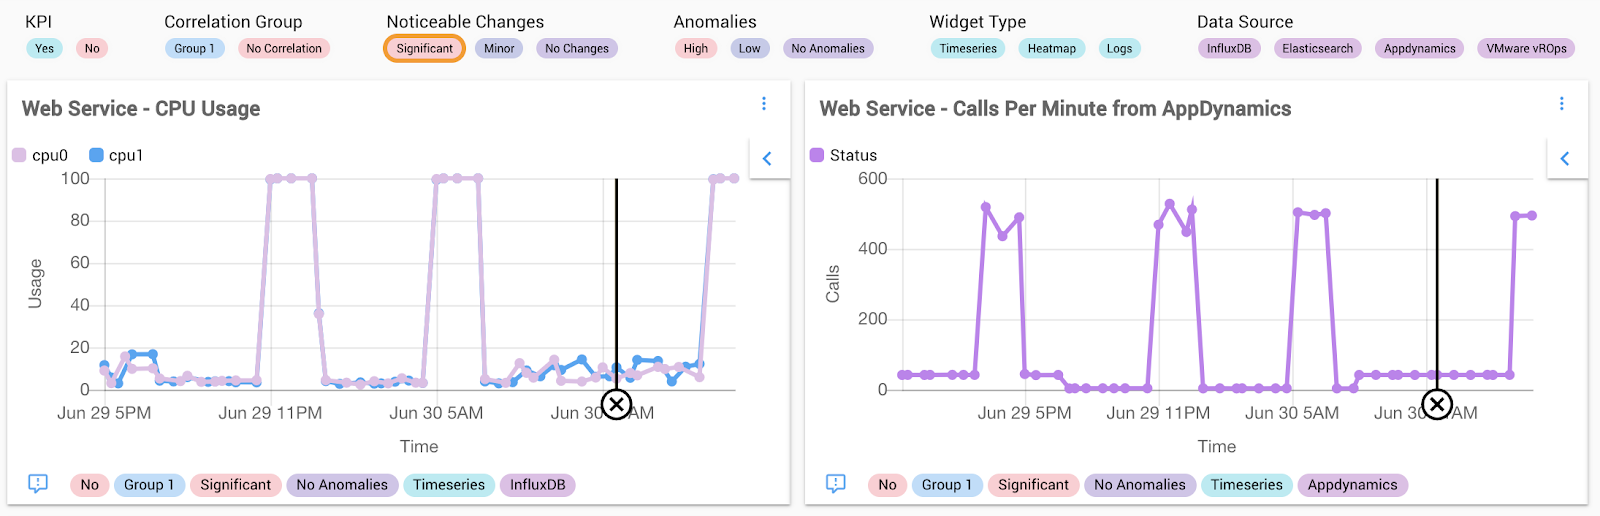
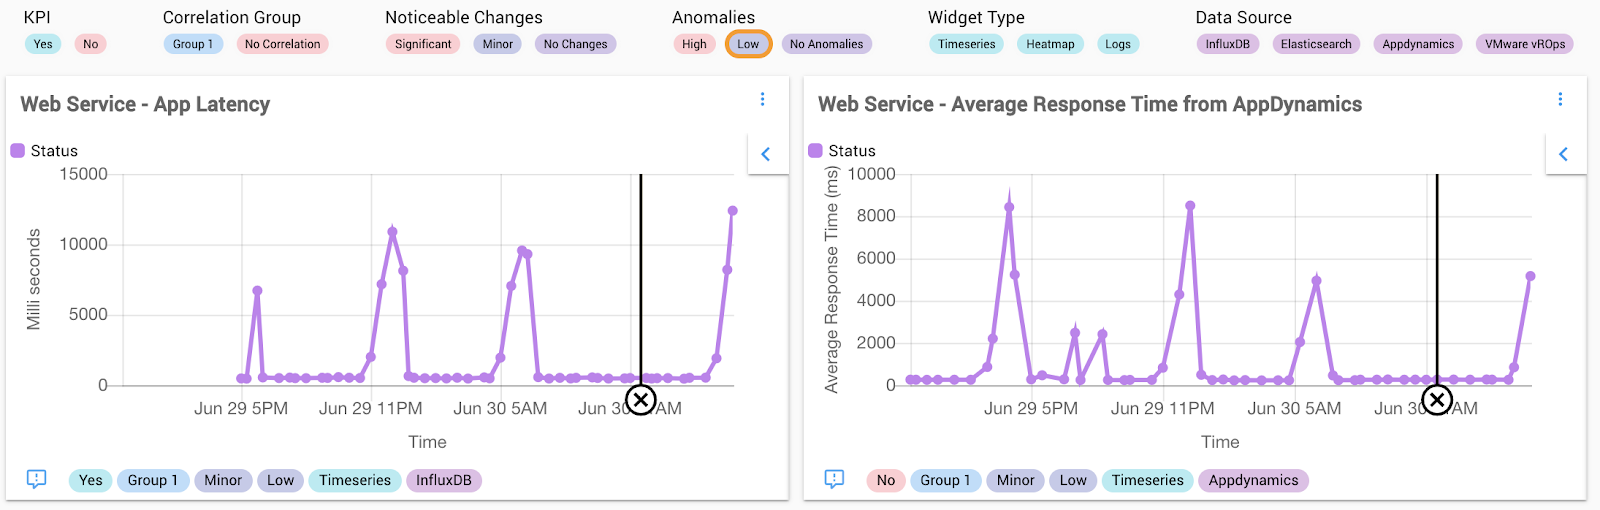
## ML Pipelines
OIA currently supports 3 ML pipelines out of the box, Clustering, Classification and Regression. ML jobs allow hyper parameter tuning by making selections from UI itself. Advanced customization scenarios allow uploading of new ML pipelines.
| **Pipeline** Type | **Description** | **Examples** |
| ----------------- | ------------------------------------------------------------------------------------------- | ------------------------------------------------------------------------------------------------------------------------------------------------------------------------------------------------------------------------------ |
| Clustering | Unsupervised grouping of data to place relatable items together | Alert clustering
Log clustering
|
| Regression | Time series data analysis for seasonality detection, anomaly detection and forecasting
| Multidimensional Analysis (ex: Critical alerts, Alerts of certain type i.e symptom, or alerts for certain app, device or site)
-Seasonality detection
-Anomaly Detection
-Prediction and / or Forecasting
|
| Classification | Identify patterns and placing items in categories or labels | Similar incidents |
# Data Exploration
Explore key IT datasets with Quick Insights
## Overview
Exploratory Data Analysis (EDA) is a popular technique to analyze data without having to explicitly program the data model or schema. This technique is very helpful to understand variance, distribution, and various other characteristics of data.
## Quick Insights
In OIA, exploratory data analysis can be performed with the **Quick Insights** feature, which can be invoked on `Incidents` and `Alerts.` Quick Insights provides a visual clue of the distribution of data across certain key parameters or attributes.
### Quick Insights on Incidents
Quick Insights on Incidents can be invoked from Incidents tabular view report
1. Go to `Incidents`
2. Click on `Quick Insights` label button located at the top right corner of the table header


### Quick Insights on Alerts
Quick Insights on `Alerts` can be invoked from `Alerts` tabular view report
1. Go to `Alerts`
2. Click on `Quick Insights` label button located at the top right corner of the table header


# RDA (Robotic Data Automation)
Integrate & move the data from anywhere to anywhere
## RDA Overview
**CloudFabrix's** **Robotic Data Automation** **(RDA)** helps enterprises realize value from data faster by simplifying and automating repetitive data ingestion various sources, preparation and transformation activities with no-code pipelines and recipes with built-in AI/ ML bots, also comes shipped with a range of pre-built AI bots.
With RDA, users will be able to author pipelines, explore data bots, visualize data sets, inspect, debug and publish pipelines across your landscape (staging, testing, production, and more).
# Accessing UI
This section explains on how to explore RDA functionality as part of cfxOIA
## Accessing RDA UI from cfxOIA
**cfxOIA Portal Login Page**\
\
In cfxOIA, 'Project' admins will be able to access RDA functionality. RDA provides end-to-end data integrations, automation, etc. across various data sources.
In order to access RDA UI via cfxOIA, login to the cfxOIA portal using the project admin role as shown in the following screen capture via the cfxOIA landing portal page.

\
**cfxOIA Applications**
Once a project admin logs into the cfxOIA portal, users will be directed to the cfxOIA applications page (as shown below).

Users now can click/select the 'Ops Intelligence & Analytics' application icon to access the cfxOIA projects page as shown below. Use the action button (three-dotted inline action) 'Configure Project' as shown in the following screen shot.
Once users clicks 'Configure Project' action button, cfxOIA takes users to RDA UI screen.

Once user clicks on 'Configure Project' button, cfxOIA UI will navigate users to UI screen that has RDA functionality as shown below.

Continue to next section to navigate RDA functionality as part of cfxOIA.
# Sources Addition and Configuration
This section covers on how to add and configure sources into cfxOIA RDA
## Accessing RDA UI
**cfxOIA Sources UI**
In cfxOIA, 'Project' admins will be able to access RDA functionality. Refer to the '[Accessing UI'](/features-guide/rda/accessing-rda) section of RDA to navigate to the main RDA landing page (as shown in the below screenshot).

Users can add various data sources (Sources) into RDA and work with data integration, data manipulation, data enrichment, data transfer (to name a few). A list of data sources that are integrated and certified with RDA is captured in 'Appendix A' of RDA.
The following section uses one example to walk you through the addition and configuration of data sources into RDA.
**Adding and configuring Sources to RDA**
Users can use the action button '+' as shown below to add and configure data sources into RDA.

Once the user clicks the '+' action button on the RDA main landing page, it will pop-ups following UI to let users pick the method of adding Sources to RDA.
The following screenshot depicts how a user can add a data source to RDA (using a pulldown menu).

**Using Credentials**
This section covers data source addition and configuration using credentials of the target data source.
This section will use the 'Service Now' data source as an example target source and walks the user on how to add and configure 'Service Now' to the RDA environment.
**Step 1**\
From the main RDA landing page, click '+' to the pop-up screen (as explained in the previous section) for adding sources.
**Step 2**\
Select the pull-down arrow from the pop-up window from Step -1. The pull-down menu selection is captured in the following screenshot.

**Step 3**\
Select 'ServiceNow' data source from the pull-down menu (as shown in the below screenshot)

**Step 4**\
Once users select a data source (e.g. ServiceNow in the above example), UI will prompt users to input all the mandatory fields required to add the data source into RDA. This is depicted in the following screenshots.

**Step 5**\
Enter ServiceNow credentials to the above UI and click 'Test Connectivity'. The following screenshot shows fully populated credentials along with the 'Test Connectivity' invocation.

Once users add credentials, configures in RDA and 'Test Connectivity' is successful, the user can save the data source configured using 'Save Button' as shown in the following screenshot.


The main landing page of RDA shows the newly added 'ServiceNow' data source along with its status 'Active' (as shown in the above screenshot).
In addition to the newly added 'ServiceNow' data source, the above screenshot depicts other data sources (AppDynamics, Nagios, vROps, VMWare vCenter, etc) that were added to the RDA environment using the above-explained steps.
**Step 6**\
Users can perform the following additional actions on the sources that were previously added to RDA
**Active Source Actions**
**Deactivate** (already active source) - This action button is provided to users in order for users to edit/update credentials.


Once a user selects the 'Deactivate' button, UI will prompt the user to confirm, once the user confirms, the data source will be deactivated for other operations (e.g. edit)


**Check Connectivity** - This action button is provided to users in order for users to test the connectivity of a source in case of any update in credentials.

Users will be able to edit credentials and verify the changed or updated credentials using the 'Check Connectivity' button (as shown in the above screenshot). Once the user clicks on the 'Check Connectivity' button, the system will pop up following the screen (all configured/active sources) to test for connectivity.

Users can click 'Test Connectivity' to connectivity to the target source (along with credentials verification) as shown below.

**Deactivated Source**
1. Activate (already deactivated source)
Users will be able to deactivate the source that was added. This action allows users to edit/update any changed credentials and re-validate connectivity (as shown below).


*Note: RDA uses RO credentials to integrate with target data sources.*
# Check Connectivity
RDA provides inline functionality to test the connectivity (validating credentials) to the target data source
As explained in earlier sections, 'Project' admins will be able to access RDA functionality to add data sources and also, will be able to author pipelines, explore data bots, visualize data sets, inspect, debug and publish pipelines across your landscape (staging, testing, production, and more).
This section captures inline functionality to validate network connectivity and credentials validation at any given point in time. The following screenshot depicts how to access this action button from the main RDA landing page.
Note: Project admins are expected to follow the 'Sources Addition and Configuration' section and add one or two data sources.

Users can click the 'Check Connectivity' button on the top right-hand corner (as shown in the above screenshot) to verify connectivity. The following UI pops up when a user clicks the 'Check Connectivity' button prompting users to select the target data source connectivity verification.

The following example depicts the 'ServiceNow' source type which a user selected to verify connectivity and its successful validation of connectivity and credentials.

UI will show 'OK' once the verification is completed.

# Proxy Settings
RDA provides inline functionality to setup proxy configuration in case cfxOIA is deployed behind proxy environment.
This section captures inline functionality to set up the proxy configuration for network connectivity where cfxOIA/RDA is deployed behind proxy and data sources will be reachable via a proxy server or environment.
The following screenshot shows the main RDA landing page depicting the inline 'Proxy Settings' action button.

Users can click the 'Proxy Settings' button to configure the proxy environment. The following screenshot shows proxy configuration UI.

The above screenshot depicts proxy settings UI provided by RDA to users. Parameters that are part of proxy configuration are explained below.
**Platform HTTP/HTTPS Proxy**\
These parameters will be configured during the deployment of the cfxOIA platform and its services. Contact your deployment team or project admin to get these values. RDA will use platform-based proxy parameters to connect to outside network/data sources.
**Platform No Proxy**\
This parameter will be used by RDA to connect to internal data sources where the target source or network address is not required to go via HTTP Proxy (e.g. connecting to internal lab sources or elements). Contact your deployment team or project admin to get the value.
**HTTP / HTTPS Proxy**\
These parameters are needed in case if project admin has not set the platform-based proxy settings and instead, wanted to use proxy configuration by RDA to connect to the outside network/data sources directly.
**No Proxy**\
This parameter will be used by RDA to connect to internal data sources where the target source or network address is not required to go via HTTP/HTTPS Proxy (e.g. connecting to internal lab sources or elements). In addition, platform-based proxy settings are not configured by the deployment team or admin.
*Note: In the above reference screenshot, the project admin has configured platform proxy. Contact your deployment team or project admin to configure RDA proxy settings*
# Explore
This section of RDA explains core functionality users will be able to explore data bots, visualize data sets, inspect.
This section of RDA explains automating repetitive data ingestion mechanism via various sources, preparation and transformation activities with no-code pipelines and recipes with built-in AI/ ML bots also comes shipped with a range of pre-built AI bots.
Users will be able to navigate to RDA 'Explore' functionality using the 'Explore' action button that was provided on the RDA main landing page as shown below.

The next sections cover Bots, Pipelines, Schedules, Jobs, etc.
# Bots
A bot deals with a particular task or a data function
**Bots**: A bot deals with a particular task or a data function. There are three types of pre-fixes to a bot's name.
**#**: Bot is source filtered. It means the data queries and filters are applied while querying the data from the data source.
**\***: Bot is destination filtered. It means the data queries and filters are applied after retrieving the complete data from the data source. It is not an efficient approach when dealing with a large amount of data, however, it can be used if the data source does not support filtering capability while querying the data.
**@**: API Endpoint. This dataset is a wrapper for an API offered by a data source.
This section covers the user interface functionality of RDA bots functionality along with a couple of data function examples. These bots or bot libraries are pre-built RDA functionality that can be leveraged by pipelines to solve user's use-cases.
The following screenshot shows the main RDA landing page depicting the inline 'Explore' action button using which users can click to navigate to 'Bots' functionality as shown below.

Users can click the 'Explore' button on the top right-hand corner (as shown in the above screenshot) to navigate to the Bots UI screen (as shown in the below screenshot).

The above screenshot depicts bots libraries that are part of pre-packaged RDA.
Each of the above bot libraries provides one logical task or logical function that can be used as part of pipelines to solve a use-case or a logical problem in cfXOIA.
A few example bots are covered in the following sections to explain each bot's functionality. The users can leverage in pipelines (pipelines section covers more in the later section).
***@c:new-block*** - Start a new block within the pipeline.
Users can use this bot in order to start a new logical section within the pipeline in cfxOIA RDA.
The following code snippet shows a simple pipeline where the '@c:new-block' bot is used to start a new block in the logical flow of a pipeline.
```
@dm:empty
--> @dm:addrow d = 'Hello World'
--> @dm:save name = 'hello-world-pipeline'
--> @c:new-block
--> @dm:recall name = 'hello-world-pipeline'
```
***@files:loadfile -*** Load the file using filename, filetype, and sheet parameters
Users can use this bot in order to load files of various types into the RDA environment. RDA supports the following file types:
1. CSV files
2. Excel files
3. Excel files with sheets
4. JSON files
*Note: File type is either csv/json/xlsx. If not specified, it will be derived from the file extension*
The following code snippet shows a simple pipeline where the '@files:loadfile' bot is load a file into the RDA environment.
```
@files:loadfile filename = "hosts.csv"
--> @dm:save name = ' hosts-dataset'
```
\
\****dm: filter -*** Apply CFXQL filtering on the data.
This bot is destination filtered. Users can use this bot to filter the data using query (or queries), store the data back in datasets.
The following code snippet shows a simple pipeline where the '\*dm: filter' bot' is used to filter the data and query only a few column names from the complete dataset using pipelines as shown below.
```
@files:loadfile filename = "surveys.csv"
--> @dm:save name = 'cfxdm-basic-filter'
--> *dm:filter * get record_id,plot_id, month,year
```
*Note: Refer to* [*CFXQL documentation* ](https://docs.cloudfabrix.io/cfxql-cfx-query-language)*for more details on filtering capabilities. Also, refer to AIOPs studio* [*RDA documentation*](https://docs.cloudfabrix.io/rda/rda-userguide/rda-aiops-studio/examples-jupyter/cfxdm-dm-filter) *for more details on the usage.*
***@dm: functions -*** List of functions available for mapping in 'map' bots
This bot library is very powerful and useful for building simple to complex pipelines. cfxOIA uses these functions to map inbound alerts, incidents, and other dynamic payload data to internal operations (e.g alert enrichment, co-relation, etc.).
The following code snippet shows a simple pipeline where the '@dm: map' bot' is used to map column names to user-defined names as shown in the below code snipped (e.g. a new label column is added to the dataset off-of ip\_address, hostname using @dm: map bot. In case if the value in one of the two columns is not available, the @dm: map function within the pipeline is instructed to substitute, 'No Label'.
```
@dm:empty
--> @dm:addrow ip_address = '10.10.1.1' & hostname = 'host-1-1' & id = 'a1'
--> @dm:addrow ip_address = '10.10.1.2' & id = 'a2'
--> @dm:addrow hostname = 'host-1-4' & id = 'a4'
--> @dm:addrow id = 'a5'
--> @dm:map from = 'ip_address,hostname' & to = 'label' & func = 'any_non_null' & default = 'No Label'
```
In addition to the above-explained bots (bot libraries), there are various bot libraries that are provided as part of cfxOIA RDA functionality.
Standalone RDA provides AIOps studio that supports all the above-explained libraries and bots that users can leverage other bot functionalities. Refer to [AIOps studio documentation](https://docs.cloudfabrix.io/rda/introduction-to-rda) for more details.
# Pipelines
A **pipeline** is a set of processing elements (bots) connected in series, where the output of one element is the input of the next one. The elements of a pipeline are often executed in sequence or in a time-sliced fashion based on the user-designed logic.
Pipelines are a commonly used concept in everyday life. Car assembly line, CI/CD environment, Big data environments to name a few.
In cfxOIA RDA context, the pipeline mechanism is supported via RDA bots which were explained in the previous section. RDA bots are designed, implemented, and logically connected to solve real-world problems. This section covers few following example pipelines that are part of cfxOIA RDA.
1. Simple example pipelines
2. Nagios pipeline
3. cmdb\_file\_load example pipeline
Note: The above example pipelines explained in this section are for reference and users are free to modify, extend and/or add new pipelines to solve other use-cases based off-of the above examples.
#### Simple example pipeline
#### Example 1
The below pipeline code snippet explains a very basic and simple pipeline that. In the above example, the pipeline consists of bots that are logically arranged or connected in series to perform the following tasks:
```
@dm:empty
--> @dm:addrow d = 'Hello World'
--> @dm:save name = 'hello-world-pipeline'
--> @c:new-block
--> @dm:recall name = 'hello-world-pipeline'
--> *dm:filter *
```
Adding a simple row ('Hello World') and saving into a logical dataset (named 'hello-world-pipeline), using new-block (bot), calling back that dataset, and printing to the console using another filter bot. This is similar to reading, saving, and printing the 'Hello World' string using pipelines and bot libraries in RDA.
The above pipeline snippet represented using bots can also be represented using YAML format as shown below:
```
name: Test-Hello-World
sequence:
- tag: '@dm:empty'
- tag: '@dm:addrow'
query: d = 'Hello " World'
- tag: '@dm:save'
query: 'name = ''hello-world-pipeline''
@c:new-block'
- tag: dm:recall
query: name = 'hello-world-pipeline'
- tag: '*dm:filter'
query: '*'
```
#### Example 2
The above pipeline code snippet explains another simple basic pipeline of creating three columns ip\_address, hostname, id, adding data to those three columns, and adding a simple logic using a bot to create a new column and filling the data. All the above-mentioned steps are put together via bots arranged in a series to solve a logical problem.
```
@dm:empty
--> @dm:addrow ip_address = '10.10.1.1' & hostname = 'host-1-1' & id = 'a1'
--> @dm:addrow ip_address = '10.10.1.2' & id = 'a2'
--> @dm:addrow hostname = 'host-1-4' & id = 'a4'
--> @dm:addrow id = 'a5'
--> @dm:map from = 'ip_address,hostname' & to = 'label' & func = 'any_non_null' & default = 'No Label
--> *dm:filter * get ip_address,hostname,id
```
The above pipeline snippet represented using bots can also be represented using YAML format as shown below:
```
name: add-new-column
sequence:
- tag: '@dm:empty'
- tag: '@dm:addrow'
query: ip_address = '10.10.1.1' & hostname = 'host-1-1' & id = 'a1'
- tag: '@dm:addrow'
query: ip_address = '10.10.1.2' & id = 'a2'
- tag: '@dm:addrow'
query: hostname = 'host-1-4' & id = 'a4'
- tag: '@dm:addrow'
query: id = 'a5'
- tag: '@dm:map'
query: from = 'ip_address,hostname' & to = 'label' & func = 'any_non_null' & default
= 'No Label
- tag: '*dm:filter'
query: '* get ip_address,hostname,id'
```
From the above two examples, users are free to create pipelines using bots convention and/or using YAML convention.
*Note: Standalone RDA AIOps studio can be used to develop, test, and publish new pipelines using the above two methods and reuse those pipelines in cfxOIA RDA for applicable use cases. Few such use cases are explained below. Refer to Standalone RDA AIOps studio documentation for details.*
#### Nagios pipeline
The following screenshot provides the 'Nagios' pipeline that is used in the cfxOIA RDA environment for Nagios alert enrichment.
**Step 1**

**Step 2**

The following screenshot provides a UI view of Nagios alert enrichment.

In addition to the above screenshot, the following depicts Nagios alert enrichment pipeline code snippet.
```
description: null
name: nagios
sequence:
- limit: 0
query: '*'
tag: '*nagios:nagios_host_group_members'
- query: name = 'nagios-host-group-members'
tag: '@dm:save'
- tag: '@c:new-block'
- tag: '@dm:empty'
- query: datasetname = 'nagios-host-group-members' & condition = "(host_name == '$assetName')"
& enrichcolumns = 'group_id,hostgroup_name'
tag: '@dm:addrow'
- query: name = 'alert-enrichment-definition-nagios'
tag: '@dm:save'
- tag: '@c:new-block'
- tag: '@dm:empty'
- query: datasetname = 'alert-enrichment-definition-nagios'
tag: '@dm:addrow'
- query: name = "alert-enrichment-pipeline-changes"
tag: '@dn:write-stream'
```
The above Nagios alert enrichment pipeline contains various logical blocks (e.g. reading the 'nagios\_host\_group\_members' dataset, and querying the dataset with a logical condition to match for host\_name to match 'assetName' via incoming payload, enrich the alert, and saving into another dataset alert\_enrichment\_definition\_nagios' and finally sending to upstream for further alert processing.
The above pipeline code snippet provides a powerful capability of RDA wherein the incoming raw alert payload is enriched by the pipeline (reading, applying logic, enriching alert with additional details) and passed onto the alert module for further processing. This enriched data can be used for ML processing and other RCA analysis.
#### CMDB example pipeline
This section provides an additional CMD example pipeline codebase snippet.


In addition to the above screenshot, following provides example pipeline code snippet for users reference.
```
description: null
name: cmdb_file_load
sequence:
- limit: 0
query: name='cmdbfiles'
tag: '@dm:recall'
- tag: '@c:new-block'
- query: name='cmdbfiles_demo'
tag: '@dm:recall'
- tag: '@c:new-block'
- tag: '@dm:empty'
- query: datasetname = 'cmdbfiles' & condition = "(DEVICE_NAME == '$assetId' or DEVICE_NAME
== '$assetName' or DEVICE_NAME == '$assetIpAddress')" & enrichcolumns = ''
tag: '@dm:addrow'
- query: name = 'alert-enrichment-definition-cmdbfiles'
tag: '@dm:save'
- tag: '@c:new-block'
- tag: '@dm:empty'
- query: datasetname = 'alert-enrichment-definition-cmdbfiles'
tag: '@dm:addrow'
- query: name = "alert-enrichment-pipeline-changes"
tag: '@dn:write-stream'
- tag: '@c:new-block'
- tag: '@dm:empty'
- query: datasetname = 'cmdbfiles_demo' & condition = "(DEVICE_NAME == '$assetId'
or DEVICE_NAME == '$assetName' or IP_ADDRESS == '$assetIpAddress' or FQDN == '$assetIpAddress')"
& enrichcolumns = ''
tag: '@dm:addrow'
- query: name = 'alert-enrichment-definition-cmdbfiles_demo'
tag: '@dm:save'
- tag: '@c:new-block'
- tag: '@dm:empty'
- query: datasetname = 'alert-enrichment-definition-cmdbfiles_demo'
tag: '@dm:addrow'
- query: name = "alert-enrichment-pipeline-changes"
tag: '@dn:write-stream'
```
In addition to adding/viewing pipelines, pipelines UI provides the following actions to end-users to work with pipelines - Details, Execute and, Deactivate.
### 1. Details
The 'Details' action button will navigate users to a new UI that presents various pipeline runs (also called jobs or job run of a pipeline ) and their status as shown in the below screenshot.

Once users click or select the 'Details' action button, UI will navigate users to the status of jobs of that selected pipeline as shown below.

The above screen capture provides a very important aspect of pipeline runtime execution (job status of a pipeline execution). Pipeline Jobs table provides important job status detail columns ( Schedule Name, Pipeline Name, Status, Scheduled time, etc). Successful completion of pipeline job shows 'Completed' status, whereas failed job shows 'Error/Failed' and provides more log details.
In addition to the above, each job run provides further actions on each job runs as shown below screenshot.

#### Check Status
The 'Check Status' action button provides the status of the pipeline job from end-to-end (as shown below screenshot). In case of any errors, it shows which step of the pipeline errored out and what is the reason.

#### Summary
The 'Summary' action button shows the overall summary details of pipeline job execution (results summary) as shown below.

#### View Results
The 'View Results' action button shows the end results as part of the current pipeline job execution as shown below.

### 2. Execute
The 'Execute' action button will let the users execute the pipeline via a job as shown below. Once, users click the 'Execute' button, UI will pop up the pipeline code along with the confirmation button (to let the users confirm the job execution) as shown below.

Once users click 'Execute', the job will be triggered and executes the pipeline in context. Results can be viewed via 'Summary' or 'View Results' buttons as explained earlier.
### 3. Deactivate
The 'Deactivate' action button will let the users disable the pipeline as shown below. In addition to deactivating, it will allow users to edit/change the pipeline as per the user's changes or requirements.


Once the pipeline is in 'Inactive' mode, users will be able to perform the following additional actions on the 'Inactive' pipeline as shown in the following (Edit, Delete, Activate)

Users will be able to Edit, Delete and Activate (back after editing) pipeline and perform the operations.
# Schedules
A series of things to be done or of events to occur at or during a particular time or period. In the context of cfxOIA RDA pipelines construct, a schedule is a particular time or period that project admins preconfigure in order to run a pipeline or pipelines.
Schedules allow admins to perform nightly or periodic job execution for data updates and/or the periodic collection or to perform a logical task (e.g. Nagios alert enrichment or CMDB data collection or vROps attributes enrichment, etc).
cfxOIA RDA provides 'Schedules' functionality allowing users to define/create schedules to perform periodic execution of pipelines. The following screenshot depicts 'Schedules' UI functionality:

Important elements that are depicted as part of Schedules UI are as follows:
Schedule Name, Description, Continue On Pipeline failure, Frequency, Cron Expression, etc.
Users can add schedules using the '+' action button provided on the main landing page of 'Schedules' UI as shown below.

Once users click the '+' action, button, RDA UI pops up the following UI to set up a schedule for a pipeline as shown below.


An example schedule for the 'Nagios' enrichment pipeline is captured via the following screenshots. Users will be able to use this as a reference to create other pipeline schedules.


Schedules UI provides the following action buttons (as shown in the screenshot)

#### Details
Details action button provides job execution details (as per scheduled as shown below)

#### Edit
The edit action button allows the users to edit previously configured schedules.
#### Disable
This action button will disable previously configured schedules.
# Jobs
In cfxOIA RDA context, the pipeline mechanism is supported via RDA bots which were explained in the previous section. RDA bots are designed, implemented, and logically connected to solve real-world problems.
cfxOIA RDA pipelines are executed via manually triggering the pipeline or via schedules. Users can use one of the mechanisms to trigger a pipeline. Once the pipeline is triggered, RDA treats the execution unit as a 'Job'. Job is a logical representation of pipeline execution during runtime (within cfxOIA RDA environment).
Each job can be a simple 'Hello World' pipeline to medium to complex pipelines (e.g. Nagios pipeline, vrOPS pipeline, etc to name a few). Users will be able to execute these and other pipelines using 'Jobs'.
RDA provides the following jobs UI to allow users to view jobs status and details.

Users can use the following screenshot as a reference for various job's statuses

# Analytics
Review Noise Reduction Efficiency and Key Analytics
## **Overview**
OIA provides Analytics to help track performance of AIOps processes (correlation, suppression etc.). Analytics are provided at Overall level, as well as at Alerts scope.
## Overall Analytics
Analytics can be accessed from Alerts section and navigating to Analytics tab in the Alerts module page
1. Navigate to `Alerts` section from left menu bar under `Project`
2. Select `Analytics` tab from `Alerts` page

# Filters Management
cfxOIA allows multi-tier filtering criteria so that the results are narrowed to the required selection. The following section explains various ways a filter can be applied.
{% hint style="info" %}
While the following examples show applying filters on incidents, the procedure is universal across cfxOIA and equally applicable to Alerts.
{% endhint %}
In cfxOIA, both on Incidents and Alerts, the user can filter the displayed results using 3 different criteria as shown below.

### Filtering Option 1- Top Bar
Wherever a user sees the following bar Fig1 (Filters bar) in any dashboard or UI functionality, you can use the filtering functionality (in the context of that UI / Dashboard or Pages).


Various filtering options displayed in Fig1a and Fig1b Filter Bar are explained below.
1. **Filter options display** Displays filter query as values selected.
2. **Filter Selection**: Click '+' icon to expand property selection bar (Fig1b). The details are given at the numbered positions.
3. **Time Filters**: Time filters allows to filter incidents based on the time periods selected from drop down menu.
4. **Clear Filter**: Clear the filters.
5. **Save current filter:** This selection opens up new view to capture filter name and also, to save the user selected filter (in the context).
6. **Saved Filters:** Retrieve existing /previously saved filters
7. **Shared Filters:** Filters shared across the customer by users are shown here.
8. **Recently Used Filters** - Allows to browse through recently used filters and allows to reapply a filter to filter the displayed results.
9. **Property** - You can use 'Any' or select various property names (column names) shown from a drop down menu after clearing 'Any'. For example, if a user wants to filter the results by Category, then a user can choose Category as Property field. Similarly, other properties are displayed to the user to select/apply those properties in filtering displayed results.
10. **Operation:** allows a use to apply conditional operator like equals, not equals, etc on a value. for the allowed operation values to appear
11. Enter a Value - User can enter the filtering value for example. if a user is filtering results by Period, then enter 6 hours so that results are displayed based on the incidents created during last 6 hours period.
12. **Display Label** - Allows to give a name to filter so that it is easy to recollect and reapply the filter.
13. **Add** - cfxOIA will apply the filtering condition on the value user has selected.
14. **Close** - Close additional filtering property /condition applying bar.
**Example:** Below report is filtered filtered by **vROps** alerts and with serverity of '**Critical**'

### Filtering Option 2 - Applying Time Filters
Time filters like previously seen age filters, allows faster filtering by selecting icon and choosing a value as described below.

Click 'Add Time Filter' as displayed above which pops up with different times
**Example**:
Select last 24 hours, the selected age is displayed as shown below\.Total Values displayed are 362.
### How to Save Filters?
Users after applying filters can save filters for lateral use.

Once the respective filter has applied, click on 'Save Current Filters' (2) as shown in above.

Save current filter view is shown. Enter a name for the filter(1) and click on Save.
If you are updating existing filter, click on 'Update Existing Filter' which displays the following screen.

Enter filter name, and from 'Select Filter to Update', choose the currently saved filters and click on Save. A sample view is displayed below

### How to Share Filter?
Existing saved filters can be shared by clicking on 'Saved Filters' and then selecting Share as shown below.

### How to access Shared Filters?
Share filter button allows to share current saved filters to other users of the project. By clicking on Shared Filters icon, it displays all currently shared filters across the project and 'Apply' applies the selected filter.

# Customizing Table Views
The following procedure explains various options available for table views.
### Toggle Table View
Users can view plain text style rows of data or in tabular format. The following is an example and can be applied across OIA different views.
On context menu of the view as shown below, click on context (hamburger) menu and click Toggle View as shown below.

The above view changes to tabular format as shown below.

### How to select columns to display in tabular view
When a tabular view is displayed, the context menu shows Column Selector option as shown below. User can select / deselect columns and click OK to apply the selection. The user can reset the selection by clicking on 'Reset' so that default columns are visible again.

### How to order Columns?
The following images shows the steps involved in changing the order of columns in tabular format.

# Exporting Data
User can export data in CSV, XLS and PDF formats. The following step by step procedure illustrates on how to export and download data.
### How to export data

1. Click on hamburger (context) menu on Alerts / Incidents View as shown.
2. A Pop with options displays - Select Export
3. An export view is displayed with multiple options including to export as CSV, XLS and PDF as dropdown menu. Also the user can chose to export either single page or multiple pages.
When user clicks on Export, depending on the number of rows of data (Size of data), the user is given two options.
If less than 5000 rows then direct desktop download as shown below.

If the data is more than 5000 rows, then you will be informed that the size exceeds for immediate download as shown.

If user received the above message, then a background process runs and places the file in My Downloads section as shown below.

When user clicks on My Downloads, the user is taken to 'My Downloads' view as shown below.

When the user clicks on Download File, then local file download option is displayed and saved as shown.

{% hint style="info" %}
Some browsers may download the file without a pop-up requesting where to download the file.
{% endhint %}
# User Roles & RBAC
User creation and assigning Roles
The platform provides various user roles, so that only authorized users can perform the required tasks. As part of the cfxOIA installation, the platform administrator is created.
This section provides guidelines on how to manage users and assign user roles so that only authorized user can access the relevant functionality of cfxOIA.
{% hint style="info" %}
cfxOIA allows creation of custom roles and allow access at page level. The following are some of the sample users. The Platform Admin is always the first user created as part of platform provision.
{% endhint %}
## Roles
The following default roles are provided by the platform.
1. **Project Administrator**: A Project administrator administers and configures the projects. The project administrator will have access to 3 core applications of cfxOIA - Ops Intelligence & Analytics, Configuration and Users.
2. **OIA User** - Overall OIA application super user with project administrator access like configuration or user management. Access to OIA application with restrictions at project level.
3. **IR User** - Incident Room User (access to Incident Room functionality only)
4. **L1 User** - Level 1 User
5. **L2 User** - Level 2 User
cfxOIA allows to create either local user or connect and authenticate users with LDAP (Lightweight Directory Access Protocol).
## Managing Users
### Create Users and Assign Role & Project
Login as Platform Administrator.
Click on 'Users' application on the Featured Applications. The existing Users summary is displayed. Click '+' to create new user.
{% hint style="info" %}
If Users are authenticated using existing LDAP providers, make sure 'Remote' on user creation is checked on. The user creation form do not capture password, as it is no longer relevant.
{% endhint %}
The user creation form captures the following information.
**Remote User** When users are authenticated using LDAP protocol, make sure it is checked.
**User ID** Enter User Id (needs to be unique and one common form is using user's email id).
**Password** Enter a password which the user can change later.
**Confirm Password** Re-enter password to match to above password
**Role** Select Role from drop-down (some examples are AIOps User, Project Admin, Incident User, Network User, etc)
**First Name** User First Name
**Last Name** User Last Name
**Select Organization** From the list displayed, select the organization(s) the user has access.
{% hint style="warning" %}
Please note in current version of cfxOIA application, on user creation view; Project is displayed as Organization (ex: Select Organization). There is no difference between a Project and an Organization within the product and used interchangeably.
{% endhint %}
### How to edit Users and Assign / Change Organization.
{% hint style="info" %}
Once local user is created, the user type is not changeable for example to Remote User.
{% endhint %}
From Users application view, select user and the context menu allows 'Assign Organizations', 'Edit User' and 'Delete User'. By selecting assign organization, the user can be reassigned to different organization(s) or add to new organization. Edit User allows to edit user details including changing user role and Delete User allows to delete the user.
{% hint style="info" %}
CloudFabrix do not recommend deleting a user. It should be used with care.
{% endhint %}
# Collaboration
Collaboration allows to configure your application/infra support teams collaboration tools into cfxOIA. This allows optimized communication between related teams in resolving an incident.
cfxOIA supports the following collaboration tools and new tools support can be easily added or developed on the need basis.
{% content-ref url="/pages/-MB5rxmJwL67vLOpL5cr" %}
[Slack](/integrations-guide/integrations/slack)
{% endcontent-ref %}
{% content-ref url="/pages/-MB5s8gfa5wwMFgPB5m-" %}
[Microsoft Teams](/integrations-guide/integrations/ms-teams)
{% endcontent-ref %}
# Projects
Projects define the core focus area for alerts and incidents. An enterprise can have one or more projects based on the business requirements.
The project administrator can create new projects and also configure the project including defining the alert sources.
{% content-ref url="/pages/-MBAv5sqTnL3ZgU5qHEj" %}
[How to add Project](/admin-features-guide/projects/how-to-add-project)
{% endcontent-ref %}
{% content-ref url="/pages/-MBAvS4\_qpe8PE2u84HP" %}
[Configure Project](/admin-features-guide/projects/configure-project)
{% endcontent-ref %}
# How to add Project
## How To Create a Project
Login as Project Administrator and select OIA (Ops Intelligence & Analytics) application. The Projects view is displayed. Click on 'Add Project'.
Enter the project details.

From above ‘Add Project’:
1. Enter Name for the Project
2. Enter Project Description
3. Enter Fully Qualified Domain Name (FQDN)
4. Enter the number of incidents that could be created within the time period. For example in the above figure, 3 incidents to be created for 5 Minutes. This is to avoid unnecessary load on the system. If more incidents are created then they will go into the ‘Throtting’ stage. The incidents that are moved to Throttling needs to be manually processed by the user.
5. Enter the number of Minutes, Hours or Day for the time period within which the above mentioned number of incidents can automatically run and fetch the data. An example is to create 3 incidents within 5 Minutes and the user enters 5 in this field.
6. Select MINUTE, HOUR or Day and this combined with the above field will define the time period. For above example, the user selects MINUTE
7. Throttle Incident after (time in minutes) - Enter the number of minutes a job can run before it is moved to throttled stage. As an example, if a job takes more than 15 minutes in pulling the information and to avoid any performance bottlenecks, the user can enter 15 in this field. Within 15 minutes, the job is not completed, then the job is moved to the throttled stage and can be completed later (when there is no other load on the system).
Click ‘Next’.
1. In the next view, it will collect incident purge settings so that unused incidents are archived after a certain time (in days). The view is as displayed below.
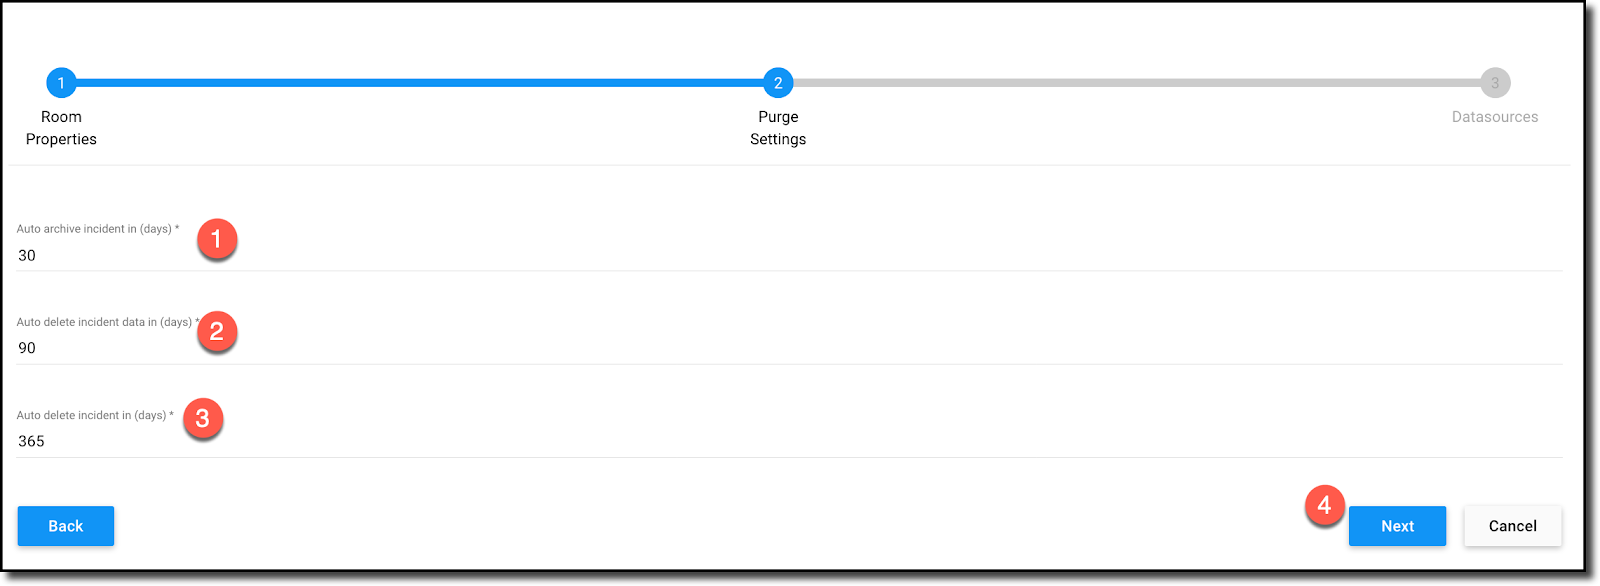
Auto archive incident in days - after the entered days, the incident is moved to archive and can be accessed from incident archive.
1. Auto delete incident data in days - after the entered days, the incident data is automatically deleted
2. Auto delete incident - after the entered days (say in 365 days), the incident is automatically deleted.
Click ‘Next’.\
In this view, select all the data sources applicable to the project and click on ‘Finish’.
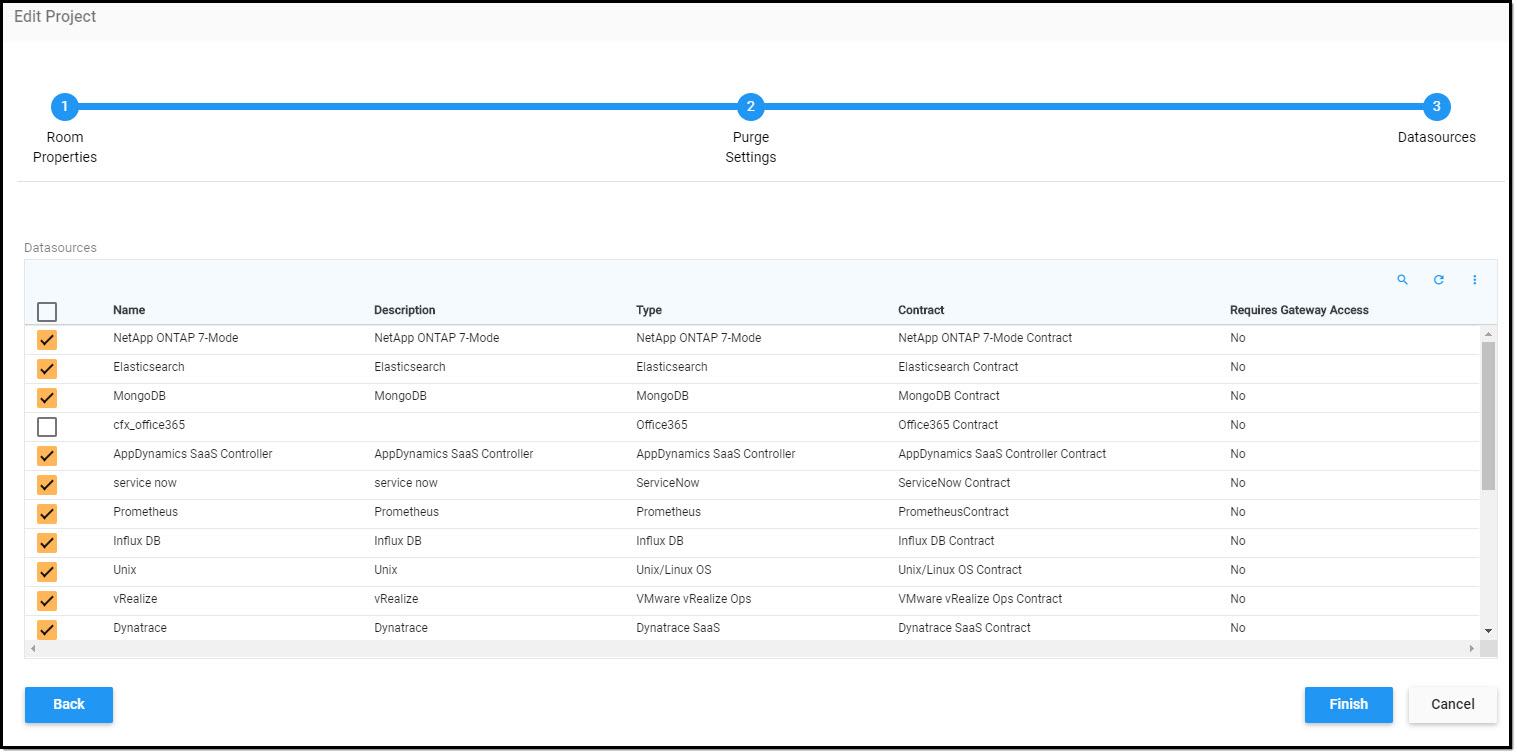
Once the project is created, it will be in an inactive stage and will move to the Active stage once background processing is completed.
Once the project is in ‘Active’ mode, the user can click ‘open’ displayed on the project to navigate into the project.
Once Project is created, it needs configuration before users can start working on Alerts and Incidents. Click [here](/admin-features-guide/projects/configure-project).
# Configure Project
On context menu of project, click on 'configure projects' as shown below.

The navigation page is as displayed below. Initially the page could be empty and follow left side page menu to navigate to various sections like Stacks, Incidents, Teams, etc to configure each of them.

Click on below page menu options to navigate and complete respective menu configurations.
{% content-ref url="/pages/-MBAxp78RnyFy8kLke\_E" %}
[Stacks](/admin-features-guide/projects/configure-project/stacks)
{% endcontent-ref %}
{% content-ref url="/pages/-MBAywN2yHh-fdpKj54d" %}
[Incidents](/admin-features-guide/projects/configure-project/incidents)
{% endcontent-ref %}
{% content-ref url="/pages/-MCHpJAxIsMZk3QM-F1D" %}
[Alerts](/admin-features-guide/projects/configure-project/alerts)
{% endcontent-ref %}
{% content-ref url="/pages/-MBAyosW92zLr3Sp94cv" %}
[Teams](/admin-features-guide/projects/configure-project/teams)
{% endcontent-ref %}
{% content-ref url="/pages/-MCHpMCMeyXpgcJQJ4q\_" %}
[Datasources](/admin-features-guide/projects/configure-project/datasources)
{% endcontent-ref %}
{% content-ref url="/pages/-MCHpPEBsKyTtFsvnU\_i" %}
[Resolution Codes](/admin-features-guide/projects/configure-project/resolution-codes)
{% endcontent-ref %}
# Stacks
A Stack is a logical grouping of related assets (software and hardware) including infrastructure. As an example, a wordpress website may include the following components to be defined as stack. The project administrator will be able to define a stack.
* A Website (ex: acme.org/wp-admin)
* App Connections (ex: )
* Web Service (ex: )
* Database Service ()
* Virtualization Host (milexi-dr-02.acme.org)
* Virtualization Host (milexi-dr-03.acme.org)
* Storage (netapp-om-nfs-10g-01)
* Network (switch-1-1-1.acme.org)
* Network (switch-1-1-2.acme.org)
* Load balancer (loadbancer.acme.org)
* Security (forti.acme.org)
A stack is the first step before Alert Watch and Incident Room are enabled.
### How to Create A Stack
Select Stacks from Configure Project Page Menu and click on '+'. Add Stack view is displayed which captures the following information.
**Stack Name** : Enter a name for stack.
**Description**: Enter description for stack
**Select Stack Template**: From the displayed stack templates, choose the stack template.
click on 'Save' to save the Stack Definition. A sample stack definition is as shown below.

Once a stack is created, the status against each created stack displays if further configuration is required or already configured. A sample view of stacks displayed below.
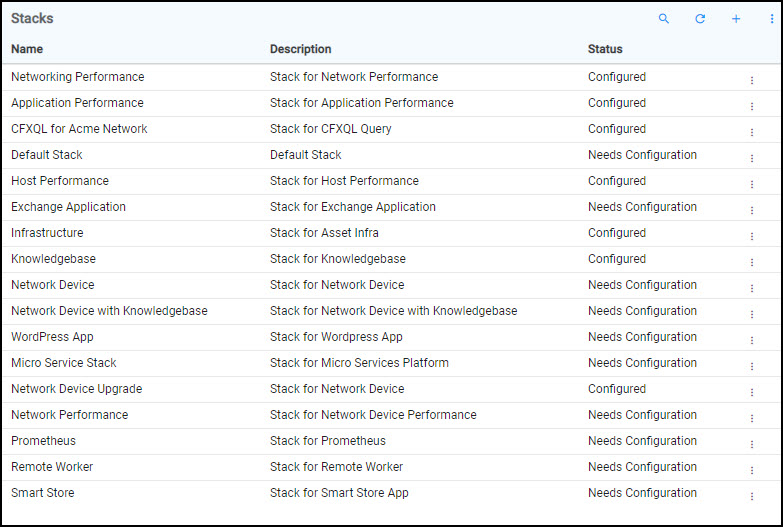
Select the stack which says ‘Needs Configuration’ to update the configuration information. A sample screen is displayed.

1. Click on context menu of Stack where status is 'Needs Configuration'.
2. Select Stack Sequence. This opens new view 'Stack Sequence'
3. The stack sequence view presents all the stack sequence items related to the stack which require either further configuration or no configuration. Select a sequence item for example 'DNS Resolver' and click on context menu.
4. Select 'Edit' from the displayed pop-up view and you are presented with Edit view.
5. Enter details requested on Edit View and click on Save. Please note for most of these edit views, the values are pre-populated based on the information available at cfxOIA and by simply clicking 'Save' completes the configuration.
Another example shows Stack Sequence for SolarWinds Resolver. In this case selecting 'Solarwinds' datasource (Which was pre-configured at OIA and Project level) and clicking 'Save' completes the configuration.

Complete each of stack item configuration and click 'Close' to navigate back to the Stacks Page.
# Incidents
As administrator select Incidents from Project Configuration Page menu. This section describes on how you can create incident end points so that the data flows from source to target (which is cfxOIA).
#### Incident Endpoints (Target)
Incident Endpoints allows to create both source and target endpoints. The source end point is where incidents are coming from and the target system normally is cfxOIA. We will create only one target end point while there could be many source end points.
1. Click on the ‘+’ icon to create either Target or Source endpoint.
2. Select Target end point.
3. Enter Name, Description and select Event type (ex: ServiceNow Ticket, JIRA Ticket, etc or OIA Ticket).
4. Select End Point type. Cloudfabrix supports various endpoint types. Some examples are webhooks, REST, CSV, Email, MangoDB, ServiceNow SaaS, etc.
5. Enter Notification ID (ex: NEW\_TICKETS,etc)
6. Once the end point is created, from the Incidents page, on the context menu click ‘Enable’ .
7. A sample entry for default OIA Incident is shown below.

#### Incident End Point(Source)
For various sources where the incidents could be residing, we need to create a source endpoint. The following procedure covers creating ServiceNow end points using a webhook.
1. Click on ‘+’ to create endpoint. Select Source as endpoint Role.
2. Enter endpoint name, description, select event type and choose endpoint type. For SalesForce the endpoint type is Webhook. Based on the endpoint type, the view expands to capture all the endpoint related information including authentication.
3. Click Save.
4. The following screens display a sample endpoint using ServiceNow as source.
\


### Incident Mapping
Once the endpoints are created, the next step is to map both source and target endpoints.
Navigation: Project Configuration -> Incidents -> Incident Mapping
1. Click on ‘+’ add to create the mapping between source and target systems.
2. Event Category will be ‘Incidents’
3. Choose to enable this mapping or to disabled by choosing Yes/No.
4. Enter description
5. Select Source Endpoint.
6. Select Target Endpoint.
7. Click Save.
Once saved, it is displayed in the Incident Mapping view as displayed below.


# Alerts
### Alerts
This section explains on how to create alert endpoints so that alerts can be ingested from source to target system. It also allows to define Correlation and Suppression policies on alerts.
Click on Alerts tab on Project Configuration page.
#### Alert Endpoint (Target)
1. Select ‘Alert Endpoint’ tab. Click on ‘+’ to create new endpoints.
2. Select ‘Target’ and enter Name, Description
3. Select Event Type (ex: Splunk Alerts, Solarwinds Alerts, vROps Alerts, etc).
4. Select Endpoint Type (ex: REST, MACAW Notification, CSV Data, Webhook, Email, etc)
5. Click Save.
A sample screen as displayed below.

#### Alert Endpoint (Source)
1. Click on ‘+’ to add the source alert endpoint.
2. Enter Name, Description, select Event Type and Endpoint Type. Click on Save.
3. From the Alert Endpoints home page, on the context menu of the endpoint, click Enable.
#### Alert Mappings
1. Click on ‘Alert Mapping’ tab.
2. click ‘+’ to select both source and target alert endpoints and chose if this mapping needs to be enabled or not
3. The following figure shows some of the alert mappings done in a demo environment.

#### Correlation Policies
A Correlation policy allows to group similar alerts, for example, grouped by environment, alert type, source system, IP address, etc.
There are two types of Correlation policies - Correlate Burst and Correlate Group.
**How to create a correlation policy?**
Navigation: Project Configuration -> Alerts -> Correlation Policies\
Click on ‘+’ to create new correlation policy
1. select either ‘Correlate Burst’ or ‘Correlate Group’.
2. Enter correlation group severity, Groupby and other details.
A sample input screen for correlation policy is as given below.


**How to create a Suppression policy?**
Navigation: Project Configuration-> Alerts-> Suppression Policies
Suppression policies help to suppress unnecessary alert noise raised for example during a maintenance window, etc. There are two types of policies - Suppress, Suppress Flapping Alerts.\
\
Click on ‘+’ to create a suppression policy.
1. Enter Name, Description, when the suppress needs to be automatically cleared, does it require repeated run, etc.
2. A Sample suppression policy is as shown below.

# Messages
Messages allows communication between teams and the collaboration tool end points can be defined here.
Click on 'Messages' on Project Configuration Page menu.
### Message EndPoints
The following view shows a sample Message Endpoints (configured).

#### How to add Message End Point?
Click on '+' to add/create new message end point. The following fields needs updation / selection.
**Endpoint ID**: Mandatory endpoint id automatically created for you.
**Endpoint Role**: Select endpoint 'Source' or 'Target' for messages.
**Name**: Enter a name to endpoint
**Description**: Provide description to the end point
**Event Type**: Select event types
**Endpoint Type**: Select the type of endpoint for example REST Data Consumer, a datasource, ServiceNow SaaS, an Email to name a few. Depending on the endpoint, the view expands to capture further information related to the endpoint for example credentials, etc.
{% hint style="warning" %}
Please contact CloudFabrix Manager if you are unable to view the required Event Type as part of end point creation
{% endhint %}
#### **Message EndPoint for Target**
Message end point for target is always cfxOIA system. Always select 'Target' as Endpoint Role' and chose 'Default OIA Message' as event type. Then select 'MACAW Notification' as endpoint type. This will be automated in future cfxOIA updates.
#### Message EndPoint for Source
The following endpoints are currently supported and please contact your CloudFabrix manager if you do not see the required endpoint.
### Message Mappings
# Message Endpoints
This section contains the information required to configure each of the message end point.
{% content-ref url="/pages/-MCIA-r7ST03UbrP\_gnB" %}
[Rest Data Consumer](/admin-features-guide/projects/configure-project/messages/message-endpoints/rest-data-consumer)
{% endcontent-ref %}
{% content-ref url="/pages/-MCIKGphcgQR0GREFeQ6" %}
[Kafka Message Consumer](/admin-features-guide/projects/configure-project/messages/message-endpoints/kafka-message-consumer)
{% endcontent-ref %}
{% content-ref url="/pages/-MCIKOMFxdjsweTuQ7np" %}
[ServiceNow SaaS](/admin-features-guide/projects/configure-project/messages/message-endpoints/servicenow-saas)
{% endcontent-ref %}
{% content-ref url="/pages/-MCIKV6y0i252aNnov2U" %}
[Webhook with Basic Authentication](/admin-features-guide/projects/configure-project/messages/message-endpoints/webhook-with-basic-authentication)
{% endcontent-ref %}
# Rest Data Consumer
The following information is required to add Rest Data consumer.

# Kafka Message Consumer

# ServiceNow SaaS

---
[Next Page](/llms-full.txt/1)