> For the complete documentation index, see [llms.txt](https://oiadocs.cloudfabrix.io/llms.txt). Markdown versions of documentation pages are available by appending `.md` to page URLs; this page is available as [Markdown](https://oiadocs.cloudfabrix.io/features-guide/alert-watch.md).
# Alert Management
**Navigation**: Once you have logged in, select OIA Application and chose the the project. In the project home page, select Alerts from left side menu.
Alerts display all the active alerts, cleared alerts and analytics.
{% content-ref url="/pages/-MBtUkTHnmDTlpGMk9MX" %}
[Alerts Overview](/features-guide/alert-watch/alerts-overview.md)
{% endcontent-ref %}
{% content-ref url="/pages/-MBtUtEfOx2Kv8QnOWHF" %}
[Broken mention](broken://pages/-MBtUtEfOx2Kv8QnOWHF)
{% endcontent-ref %}
{% content-ref url="/pages/-MBtUyJgRfn4hl8H1QKb" %}
[Broken mention](broken://pages/-MBtUyJgRfn4hl8H1QKb)
{% endcontent-ref %}
{% content-ref url="/pages/-MBB3LxNUe0RZPHIA2c7" %}
[Filters Management](/ui-and-portal-features-guide/filters.md)
{% endcontent-ref %}
The home page is as displayed below:
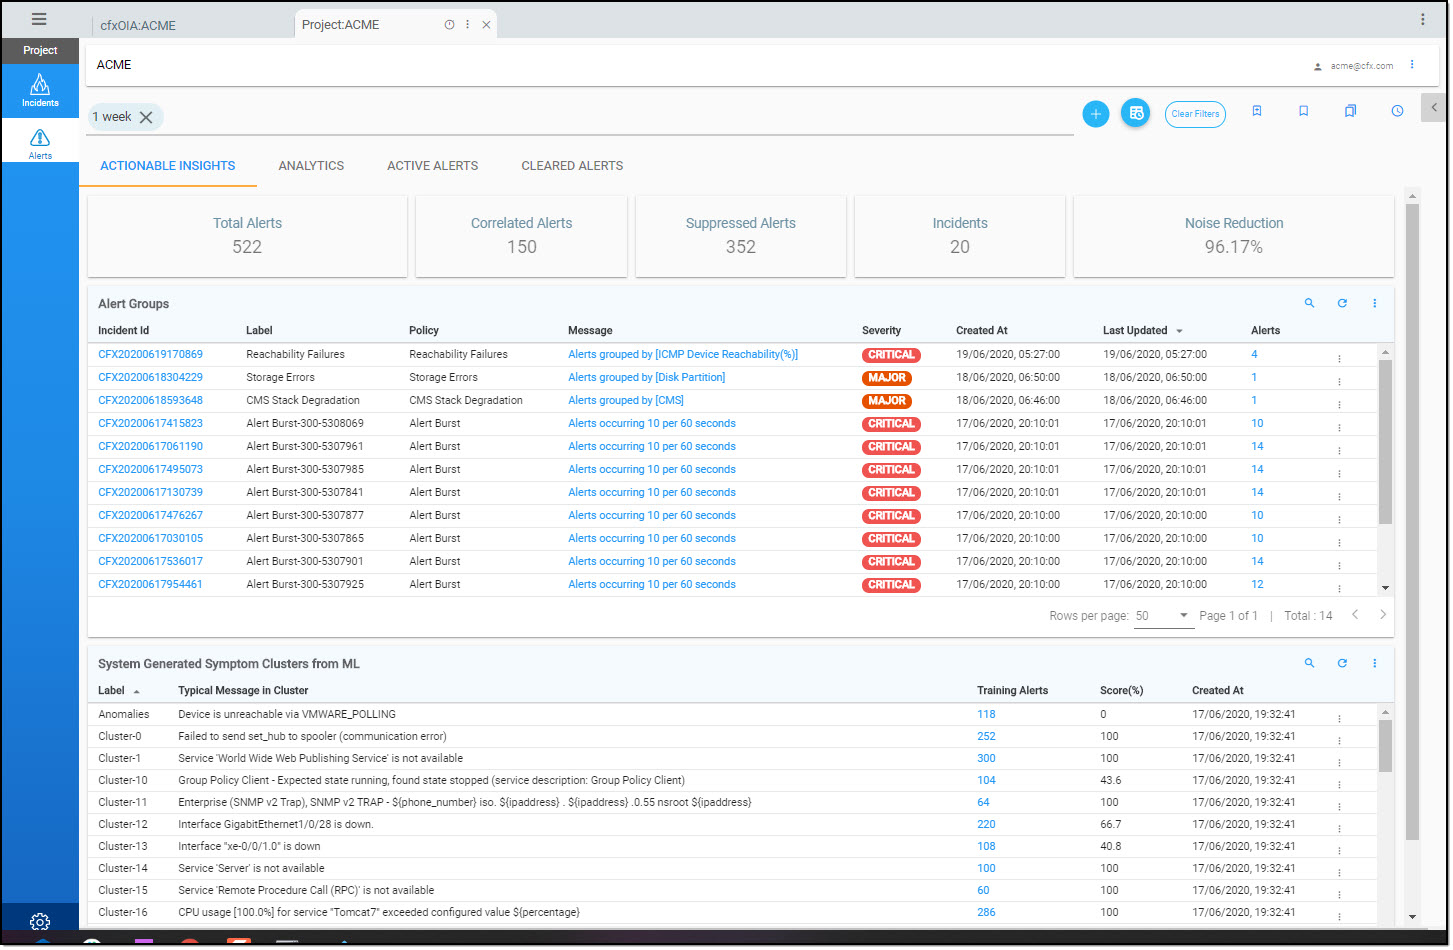
The major functionality available at Alerts are:
1. Actionable Insights, 2) Analytics, 3) Active Alerts and 4) Cleared Alerts
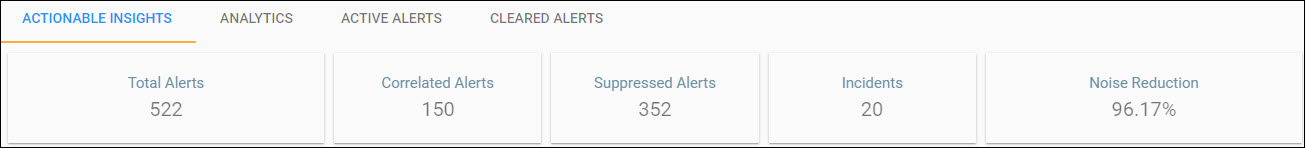
### Actionable Insights:
Actionable insights provide a summary of alerts and how many alerts were correlated and suppressed. It also displays the number of incidents created. A Sample screen is as shown below.
Next to the summary view is Alert Groups. Alert groups display the incidents, the severity, and how many alerts are merged in the incident. A sample screen is displayed.

By clicking on any incident, more information about the incident can be obtained. Once an incident is selected, it opens in a new window with incident related information. At this point of time, it ingests the data and applies the logic. Hence, it takes a while to display. \
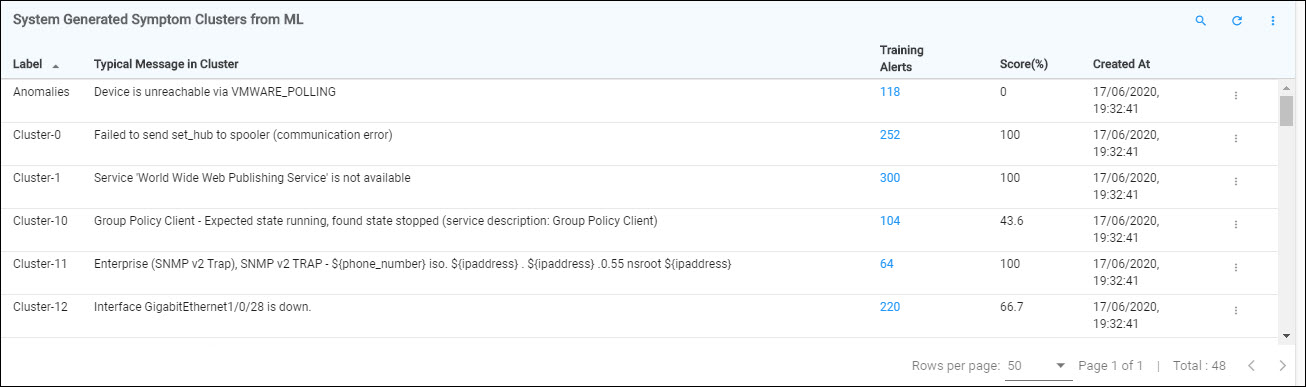
The below view under alert groups is Clusters created using Machine Learning (ML). A sample view is as displayed below.
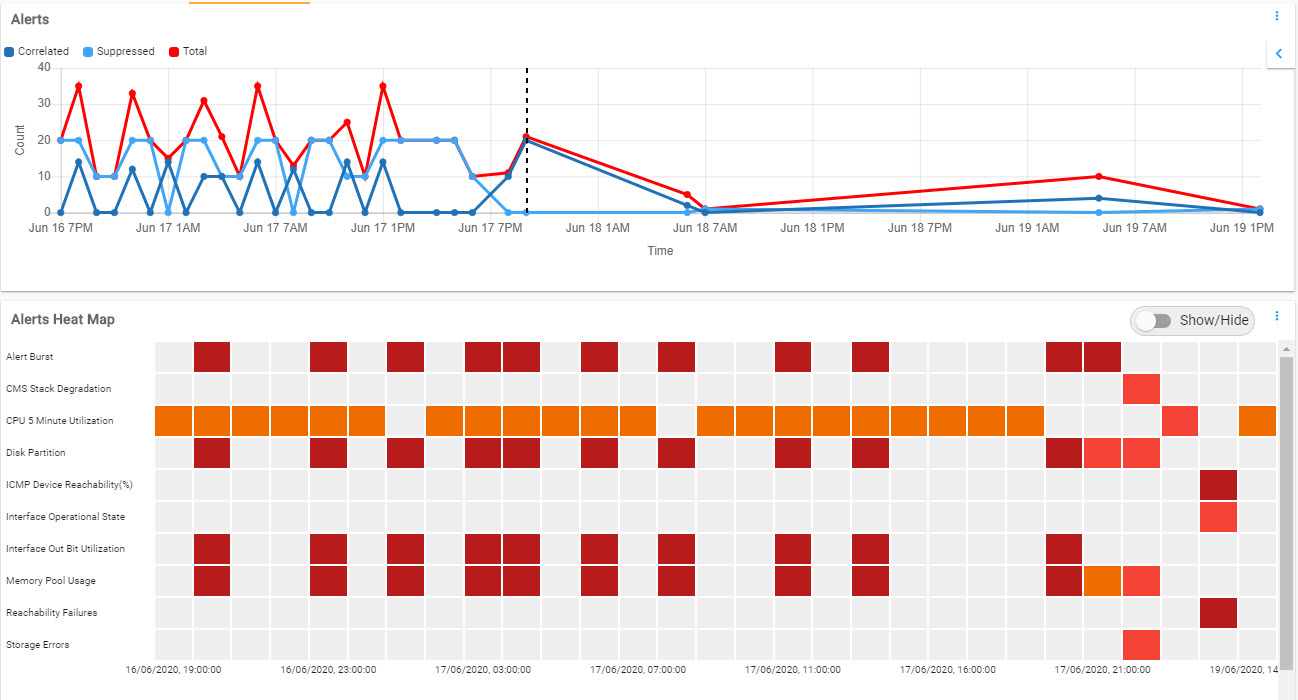
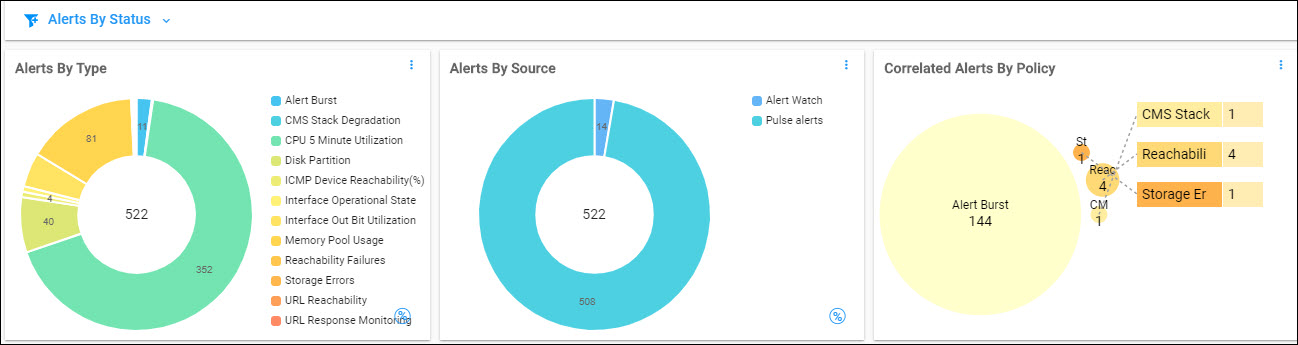
### Analytics
Analytics provides various alert information by alert type, alert source , heat map and correlated alerts. The following provides sample visualizations.
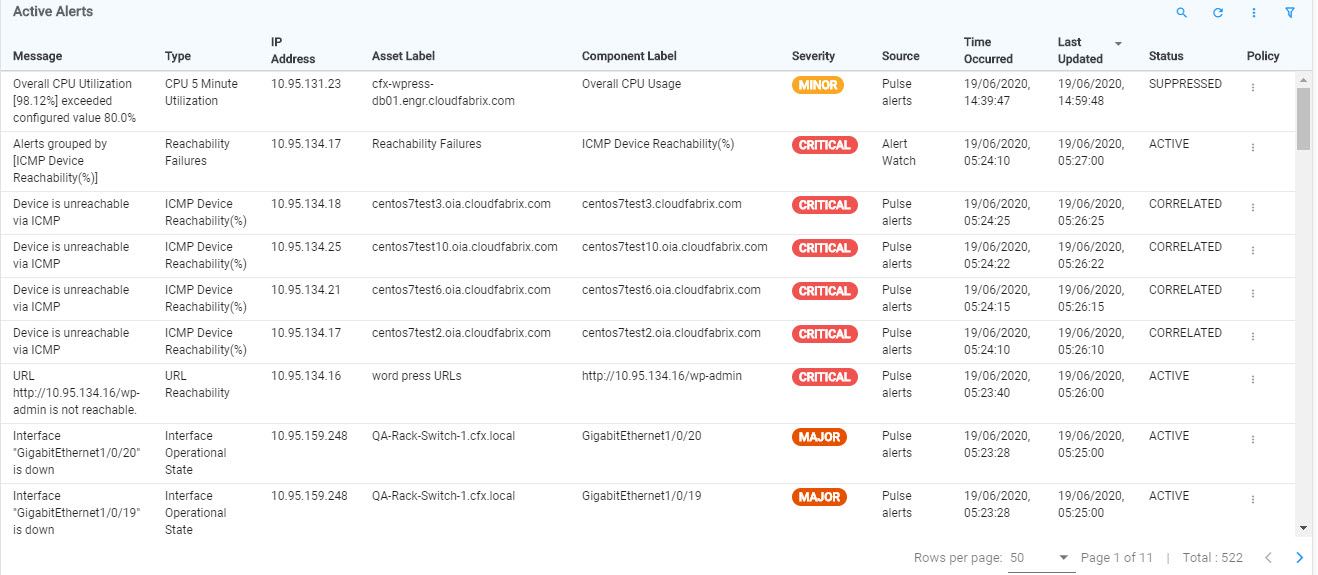
### Active Alerts
Active alerts displays all the alerts which are active or correlated. On any of the alerts, the context menu allows to delve more into the source, additional attributes, or to clear the alert. A visualization is as displayed below.
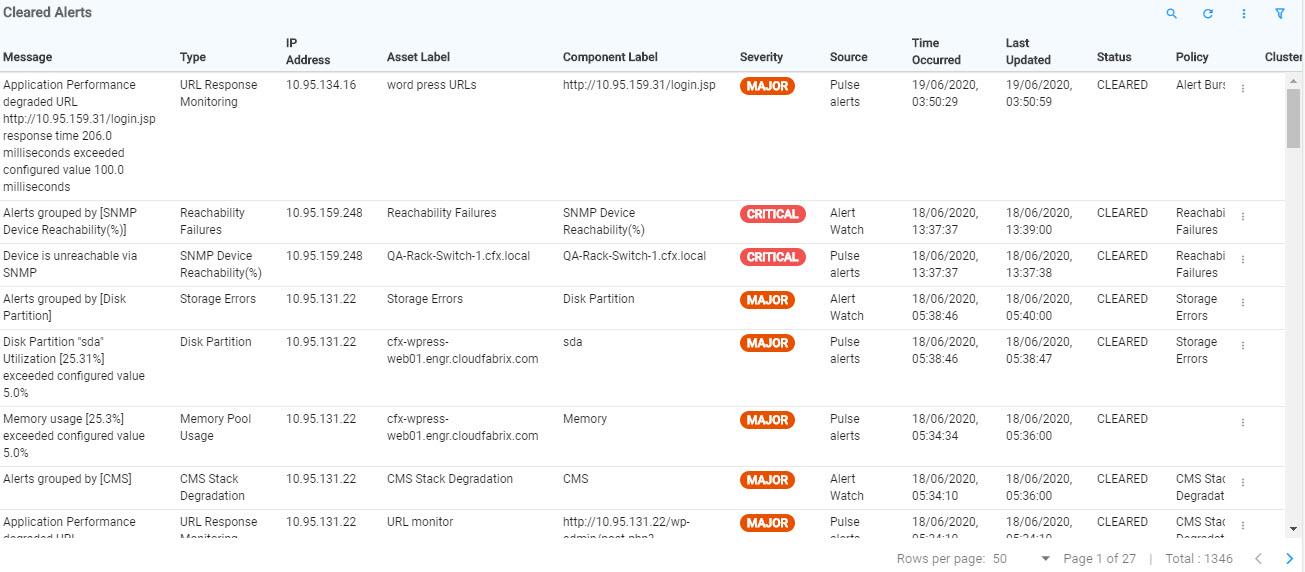
### Cleared Alerts
All cleared alerts are displayed here. A sample visualization is as displayed below.