> For the complete documentation index, see [llms.txt](https://oiadocs.cloudfabrix.io/llms.txt). Markdown versions of documentation pages are available by appending `.md` to page URLs; this page is available as [Markdown](https://oiadocs.cloudfabrix.io/integrations-guide/integrations/splunk-enterprise.md).
# Splunk Enterprise
## **Prerequisites:**
1. Splunk Enterprise Version 8.0.0
2. Splunk Indexes (Please refer Splunk Documentation on how to create indexes)
a. Eg: Webserver host logs created with log index “web\_error\_logs” with field values hostname, severity, ipaddress etc...
b. DB Server host logs created with log index “db\_error\_logs” with field values hostname, severity, ipaddress etc...
**Note-1**: For field “severity”, you can extract from the log message (Eg: info, error, warn, debug etc)
**Note-2**: Fields “hostname” and “ipaddress” should be the HostName and IP address of the host on which Splunk agent is installed and collecting the OS or Application logs.
To add the above custom fields on Splunk Agent follow the below steps (Linux version).
```
cd /opt/splunkforwarder/etc/system/local
--> Edit inputs.conf
--> Add the below line to add additional fields
_meta = key1::value1 key2::value2
Eg: _meta = ipaddress::10.95.131.23 hostname::cfx-wpress-db01.demo.cloudfabrix.com
--> Restart splunk agent
/opt/splunkforwarder/bin/splunk stop
/opt/splunkforwarder/bin/splunk start
```
3\. Enable API port 8089 on Splunk Enterprise administration UI
### Enabling API Port 8089
**Step 1**: Log into Your Splunk Enterprise Instance with admin credentials
**Step 2**: From Top Menu bar, click on 'Settings' tab.
**Step 3**: Click on 'Server Settings' and then on Server Settings screen, click on "General Settings".
**Step 4**: For creating a data source plugin in CloudFabrix OIA, Management Port needs to 8089 and enter value as shown below.
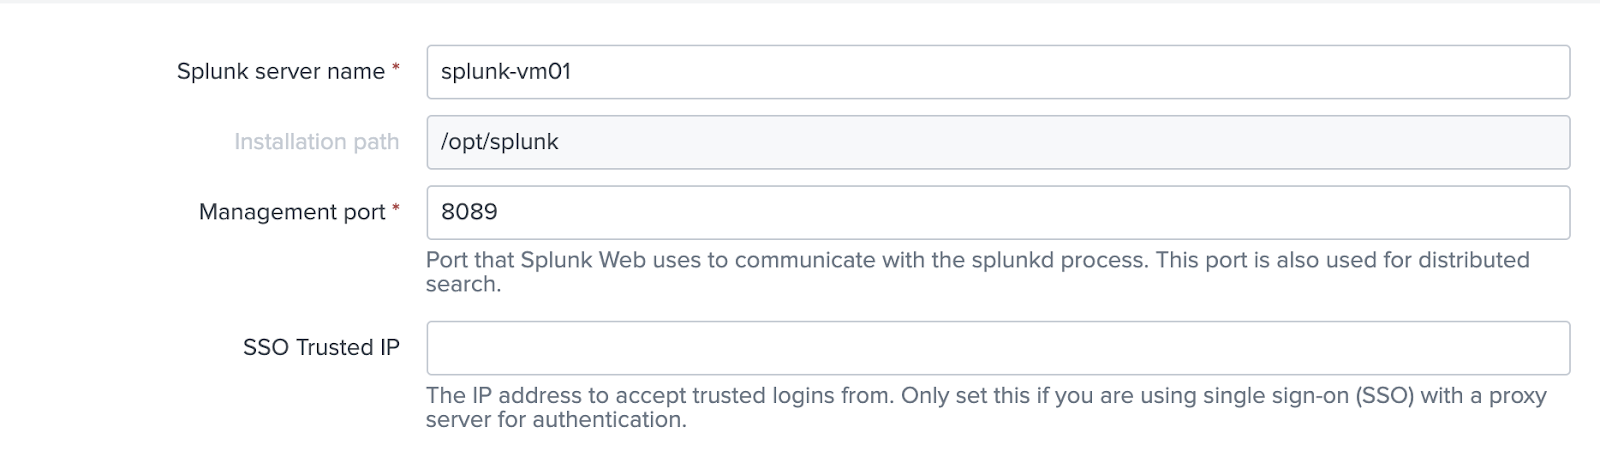
Management Port = 8089
## Addition of Splunk Enterprise as DataSource
**Step 1**: Login to cfxDimensions with user credentials.
**Step 2**: Under Data Sources App, select '+' on top right corner to add new Data Sources.
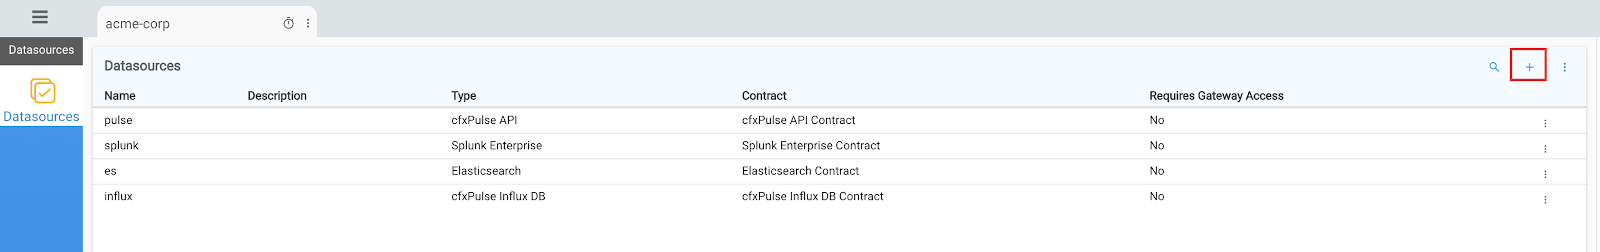
Add new data source
**Step 3**: Select 'Splunk' as Data Source Type as shown.
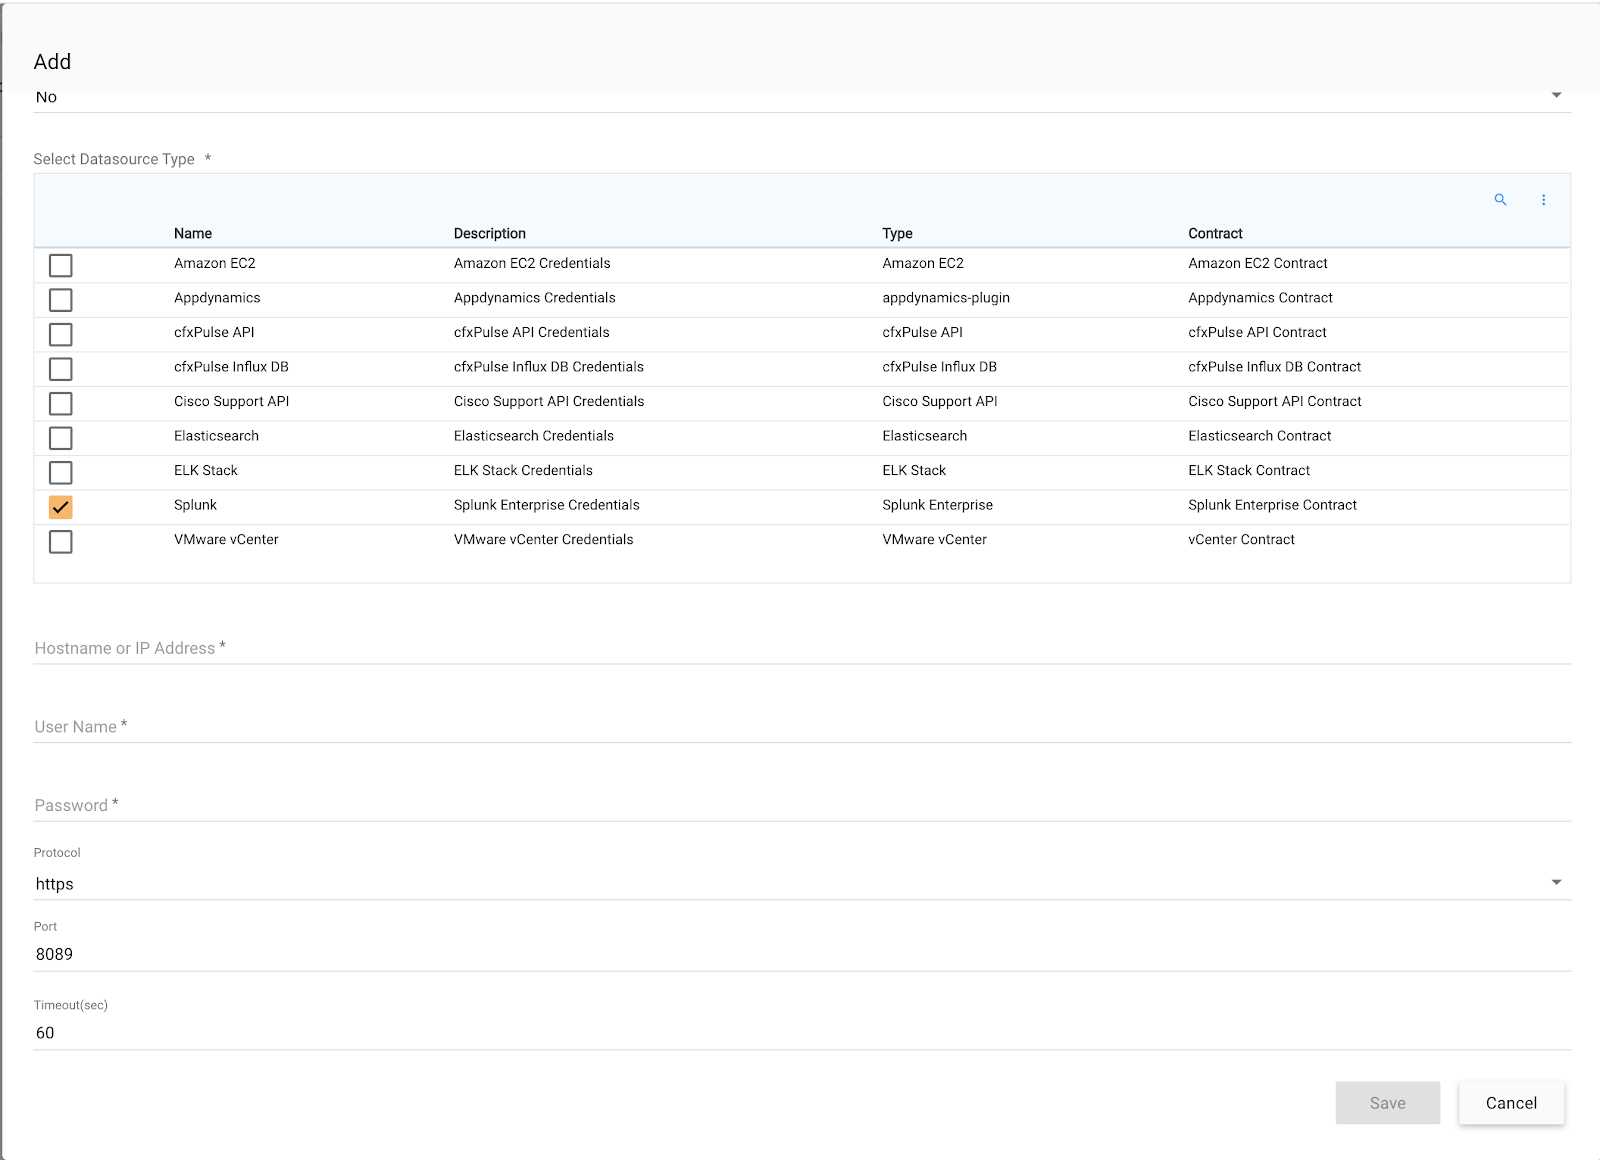
Splunk as Data Source
Enter the required details. The details required are
**HostName**: Splunk Enterprise System IP address
**UserName**: Username with admin rights
**Password**: Specify the password for the admin user
**Port**: API access port configured in previous section from Splunk Enterprise Instance (default: 8089)
**TimeOut**: The time required to wait for the response.
**Note**: Please chose https over http as http is not supported by Splunk.
## Adding Splunk Enterprise Data Source in the Incident Room
**Step 1**: Login to cfxDimensions App and then click on OIA App.
**Step 2**: After creation of Data Source, add it under incident room creation.

Add Project
**Step 3**: An incident gets created from Splunk Instance. You can also create new incidents.
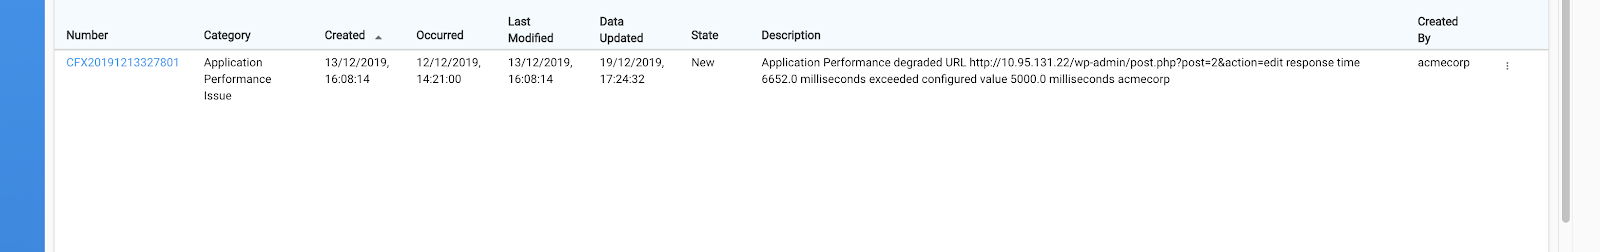
Splunk Incident
**Step 4**: Click on Incident / ticket.
You data source widget chart (App Logs From Splunk) is as displayed below.
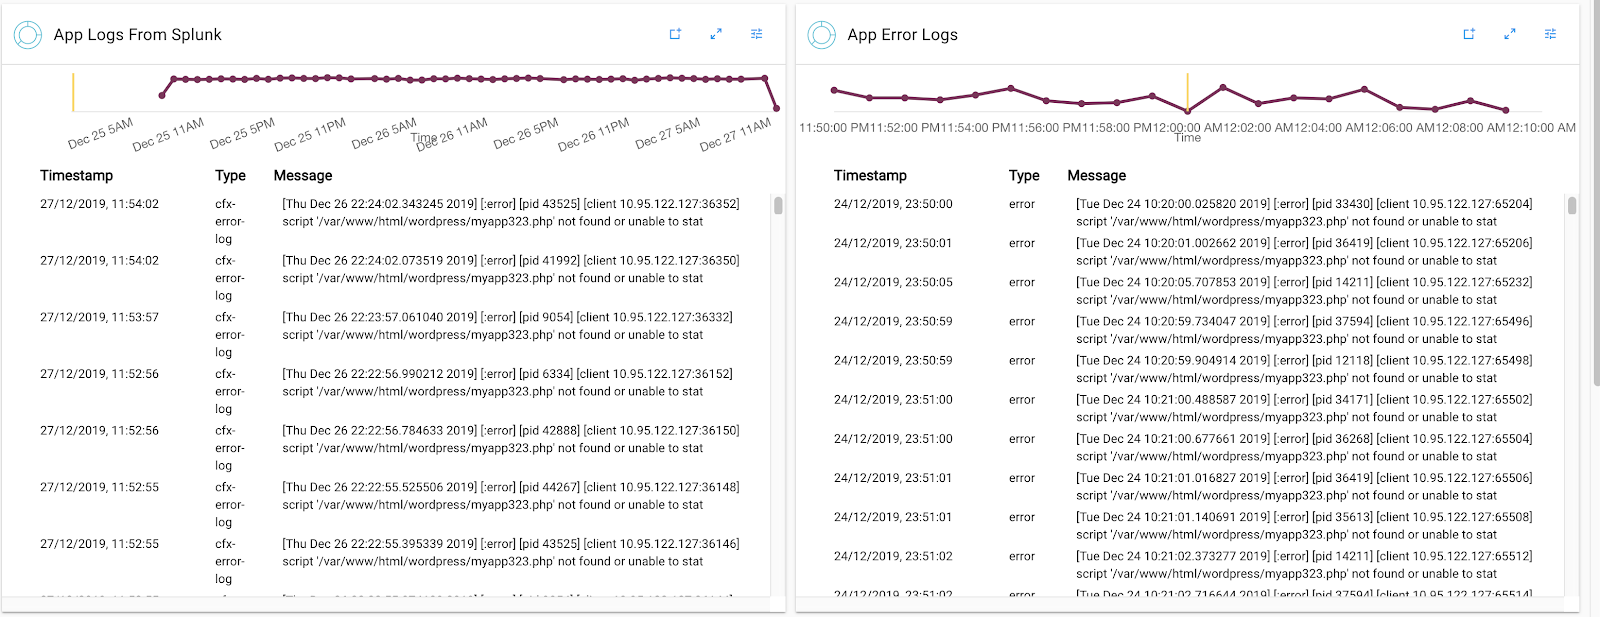
The fields (Timestamp-> *time, Type->sourcetype, Message-> \_*raw)
**Note**: *time, sourcetype,* raw are Splunk index fields that are required to be present in the index.
## Creating Alert Source for Splunk Enterprise
**Step 1**: Login to cfxDimensions and then select 'OIA app'.
**Step 2**: Select the Incident room where you want to add the alert source.
**Step 3**: Under Alerts tab, select Alert Sources on the right hand side corner as shown.
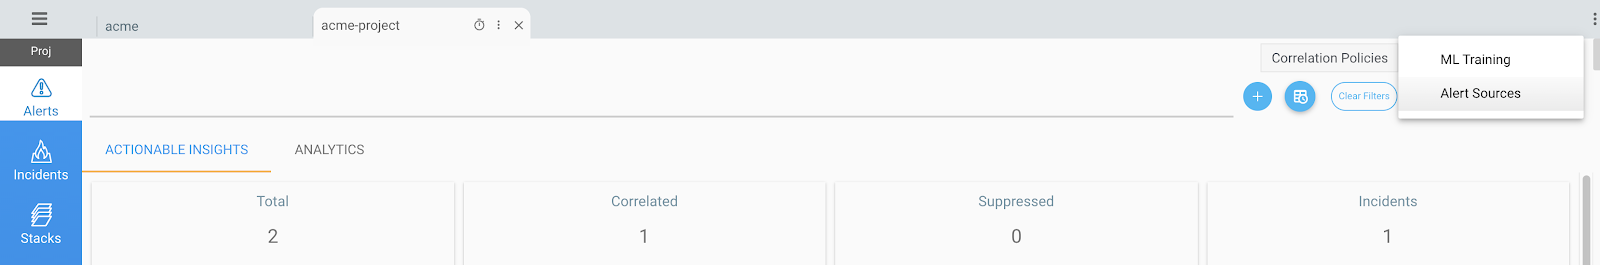
Select Alert Sources
**Step 4**: Click on '+' to add new Alert Source as shown.
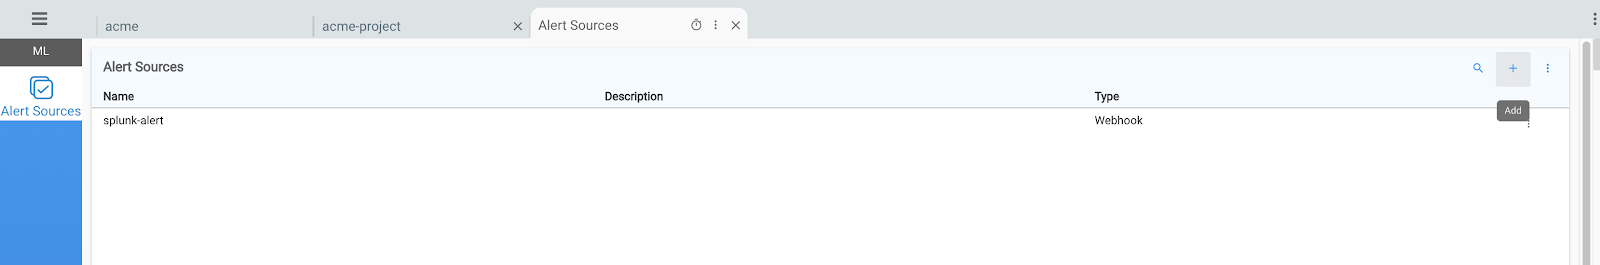
Click '+' to add new alert source
**Step 5**: Select Alert Source Type 'SplunkEnterprise' as shown.
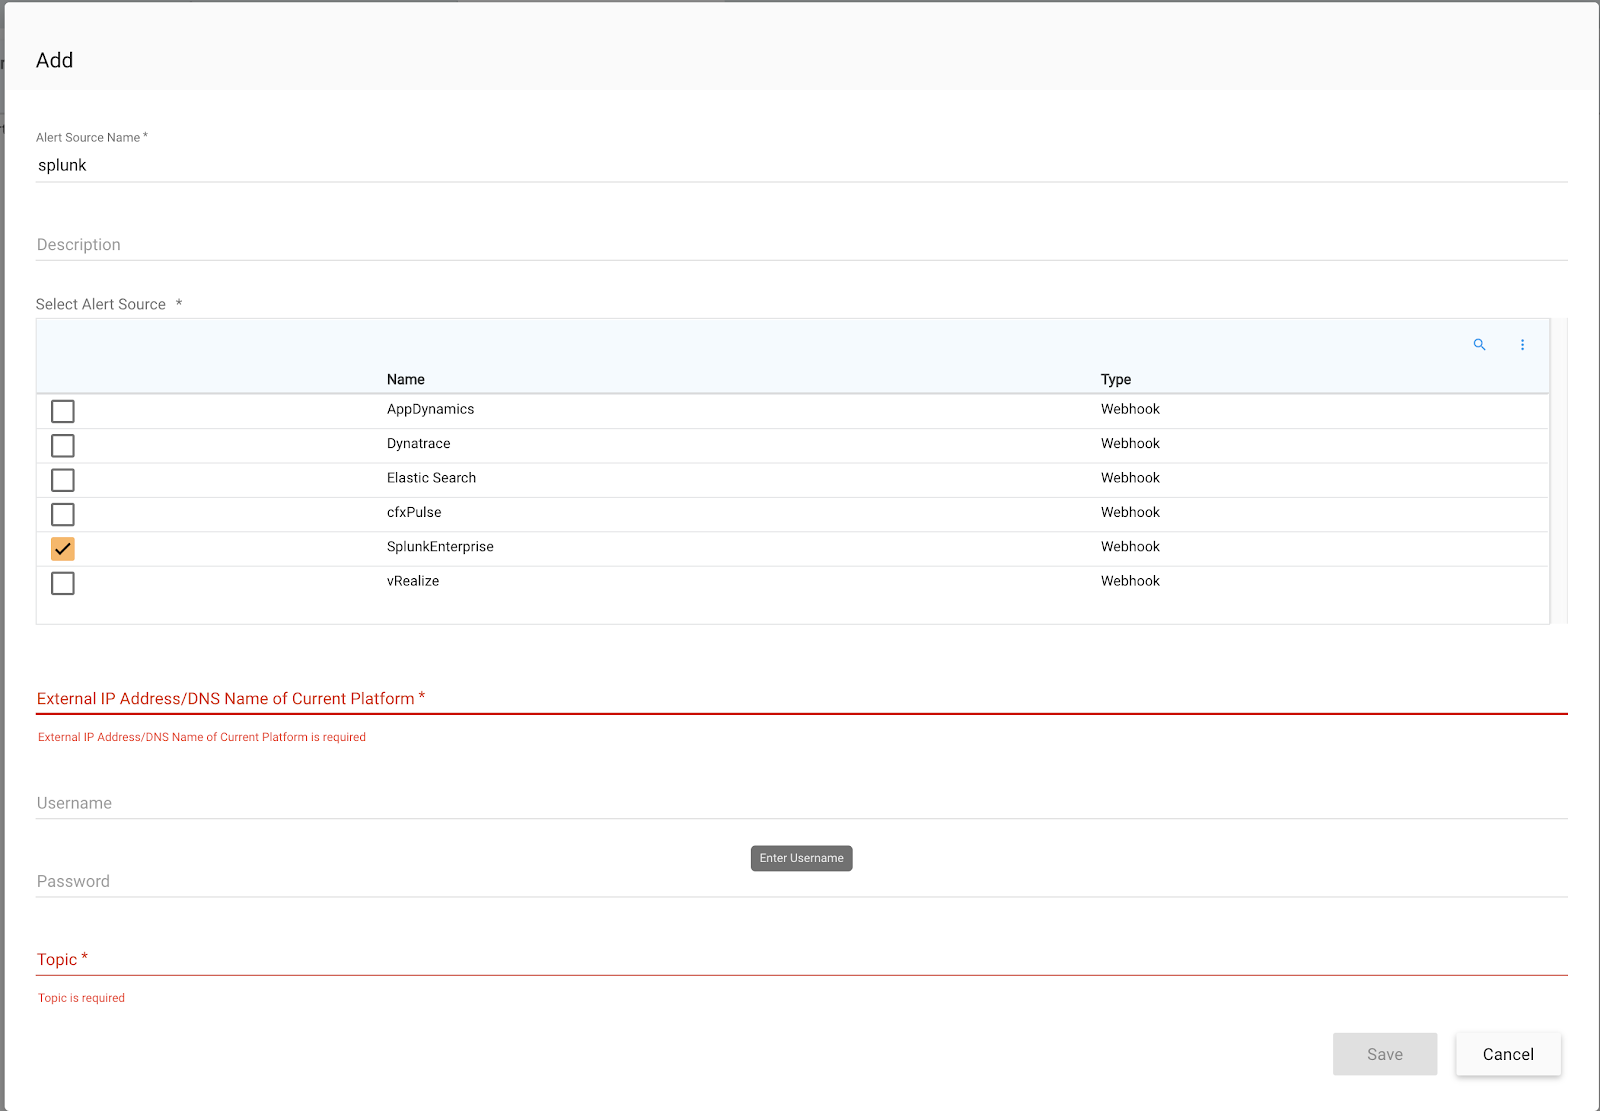
Selecting Splunk Enterprise as Data Source
Enter your cfxDimensions system DNS name or IP address as External IP address and 'inbound-alerts' at Topic field.
Click Save.
**Step 6**: From Alert Sources, select the hamburger menu on created source and click on View Details as shown.

The Details are as shown below.
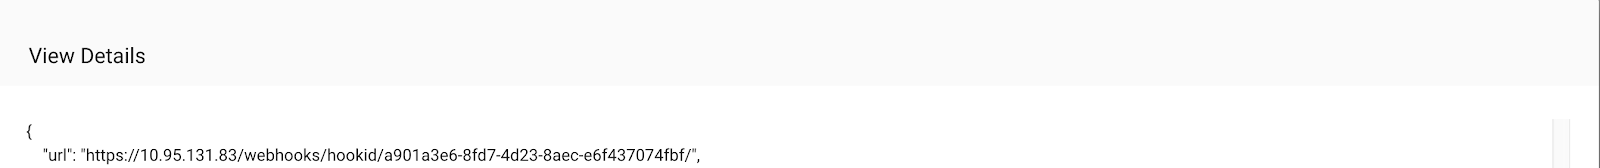
**Step 7**: Copy the displayed URL in view details which follows the format "https\:///webhooks/hookid//".
**Step 8**: Login to Splunk Enterprise Instance
**Step 9**: Go to 'Search and Reporting' section.
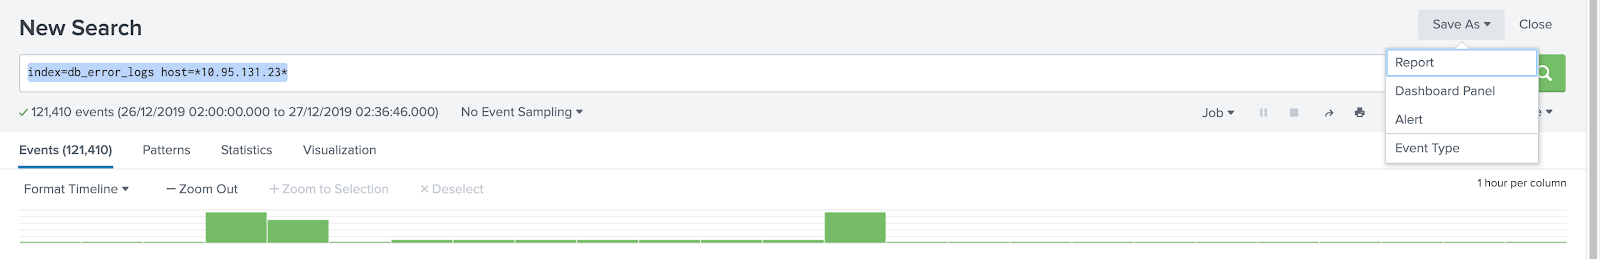
**Step 10**: Create new search from the pre-requisite index mentioned earlier in the document. Make sure you have the required field values mentioned. For example, Eg index = db\_error\_logs, host = \*ip address\*
**Step 11**: Save the search as alert
**Step 12**: While creating alert, the following 'Save As Alert' is displayed.
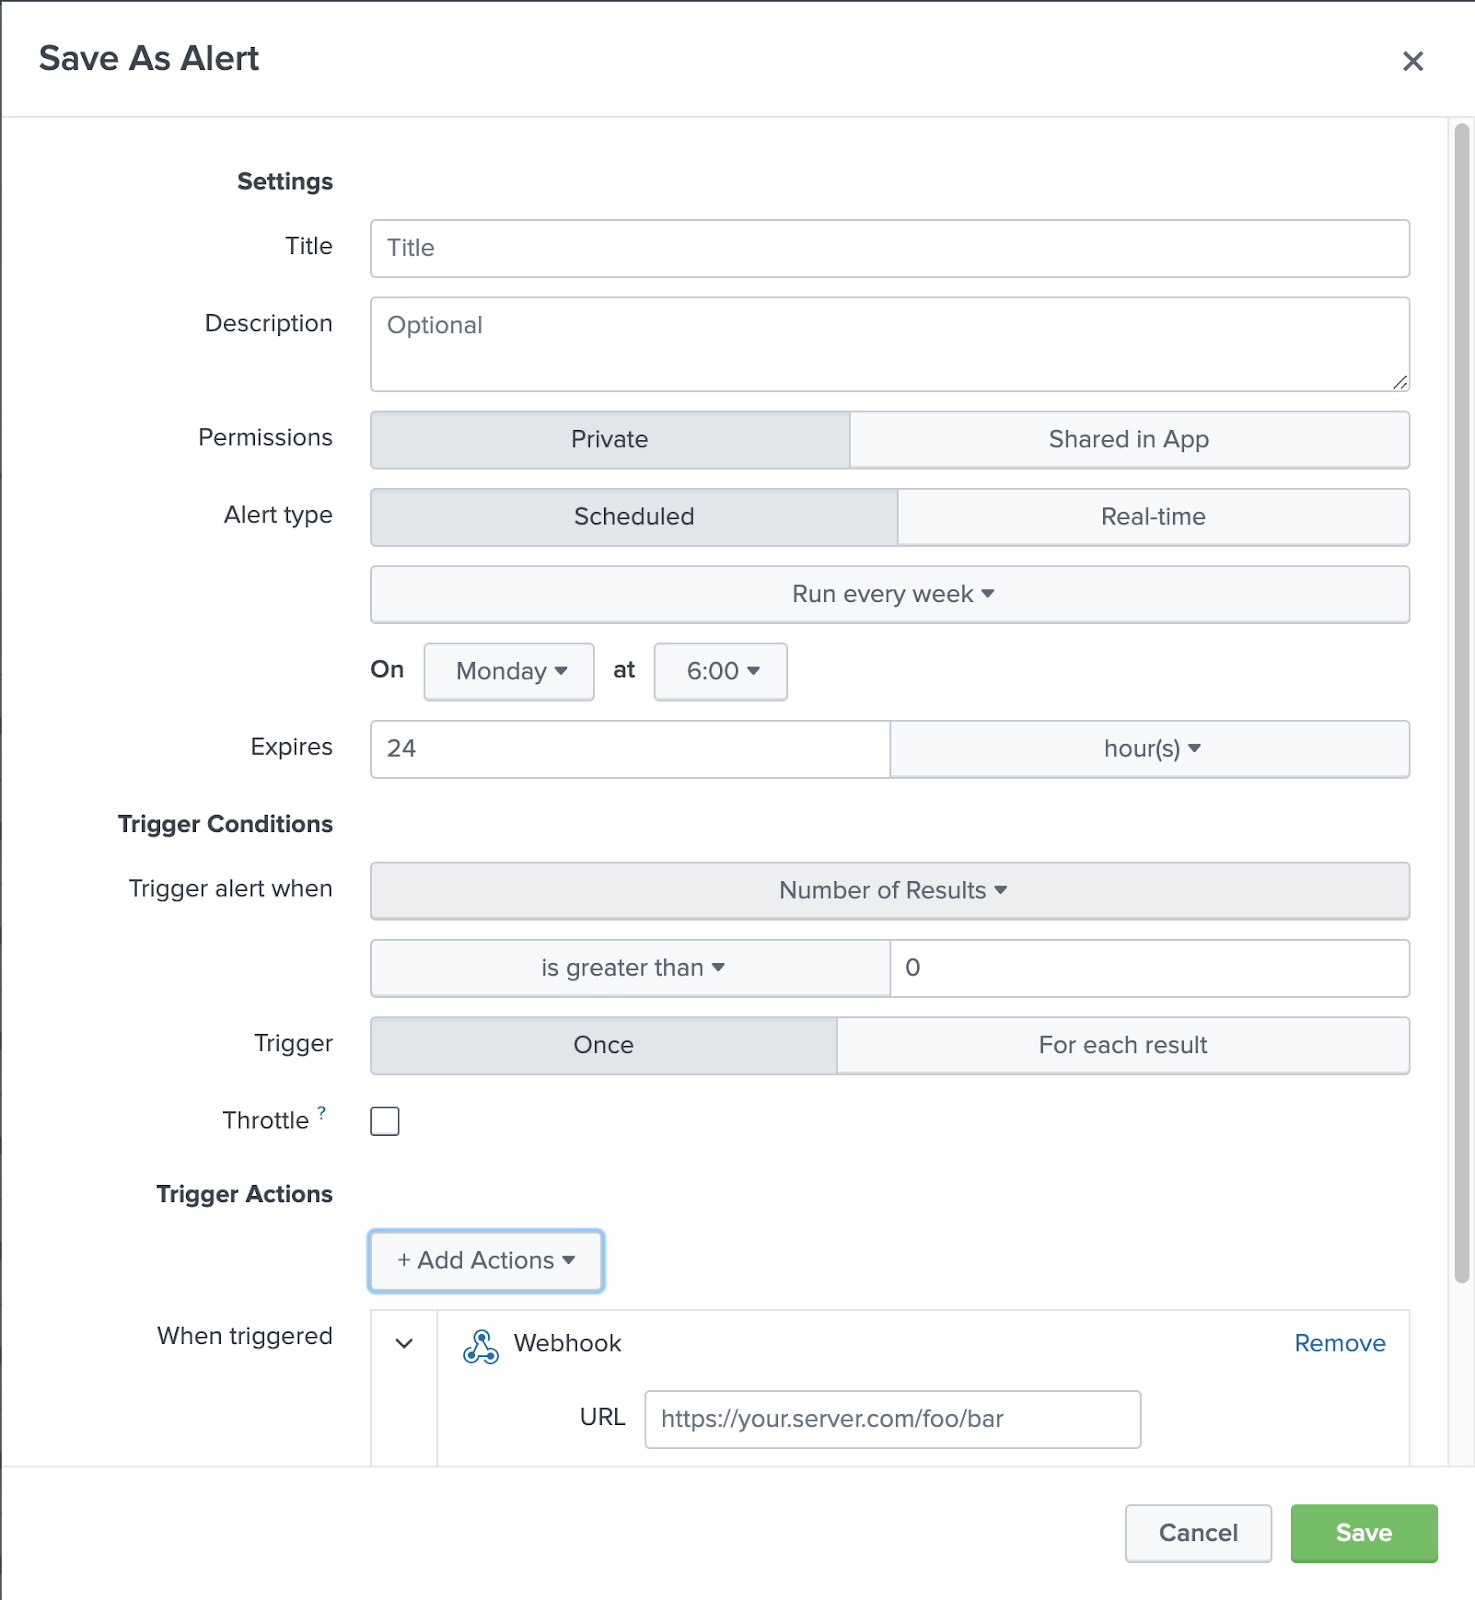
Select 'Webhook' from Actions drop down. Paste webhook url from earlier alert source. Enter alert name and any conditions.
Save the Alert.
**Step 13**: The alert can be viewed or edited from under the Alerts tab.
**Note**: More information on Splunk alerts can be read [here](https://docs.splunk.com/Documentation/SplunkCloud/8.0.1/Alert/Aboutalerts) ().
**Step 14**: It takes a while before alert is displayed in the OIA app which in turn creates it as an incident.
**Step 15**: These can be viewed in OIA app under alert tab.
Login as Customer Admin User into cfxDimensions App.
An example alert payload from Splunk is as shown below
```
{
"search_name": "web logs alerts",
"owner": "admin",
"sid": "rt_scheduler__admin__search__RMD549d1c662f912271f_at_1577189234_887.781204",
"result": {
"_sourcetype": "cfx-error-log",
"_time": "1578399544.002748",
"date_mday": "7",
"_kv": "1",
"punct": "[___::._]_[:]_[_]_[_...:]__'/////.'______",
"severity": "error",
"_serial": "1815613",
"index": "web_error_logs",
"linecount": "",
"sourcetype": "cfx-error-log",
"date_month": "january",
"_confstr": "source::/var/log/httpd/cfx-error-log|host::cfx-wpress-web01|10.95.131.22|cfx-error-log",
"ipaddress": "10.59.113.22",
"source": "/var/log/httpd/cfx-error-log",
"timeendpos": "32",
"_eventtype_color": "",
"date_minute": "19",
"pid_id": "16494",
"splunk_server": "splunk-vm01",
"hostname": "cfx-wpress-web01.demo.cloudfabrix.com",
"_raw": "[Tue Jan 07 04:19:04.002748 2020] [:error] [pid 16494] [client 10.95.122.127:43968] script '/var/www/html/wordpress/myapp323.php' not found or unable to stat",
"date_second": "4",
"date_zone": "local",
"_subsecond": ".002748",
"date_wday": "tuesday",
"host": "cfx-wpress-web01|10.95.131.22",
"eventtype": "",
"timestartpos": "5",
"_indextime": "1578399544",
"date_hour": "4",
"date_year": "2020",
"_si": [
"splunk-vm01",
"web_error_logs"
]
},
"results_link": "http://splunk-vm01:8000/app/search/@go?sid=rt_scheduler__admin__search__RMD549d1c662f912271f_at_1577189234_887.781204",
"app": "search"
}
```
## Table describing the field mappings between Splunk Alert Payload and Alert Watch Fields.
1. **Raised At** : This field describes the time at which the alert was last occurred . Eg - The last occurred time on the incident ticket . (08/01/2020, 15:05:12)
2. **Asset Id** : This field uniquely Identifies an asset Eg (cfx-wpress-web01.demo.cloudfabrix.com) or Any UUID
3. **Asset Name** : This field describes the host name of the Device where alert is coming from, (Eg any FQDN (cfx-wpress-web01.demo.cloudfabrix.com)
4. **Asset Type**: The Type of the device that is raising alert .Here in this case ‘cfx-error-log’
5. **Asset IP Address** : The ip address of the device where the alert was raised form Eg (10.95.131.22)
6. **Alert Category** : The Type of the alert that device raises. In case of Splunk its same as the sourcetype of the log i.e ‘cfx-error-log’
7. **Component Id** : An unique identifier which identifies the sub component form the log messages. Eg In Logs the Source of the log messages
8. **Component Name**: The name of the Component (‘the path of the source log message’)
9. **Severity**: Alert Severity Ordered Number 0 - Critical, 1 - Major, 3 - Minor,
10. **Message** : This field describes the Log messages
11. **SourceId** : ‘The index form the splunk logs’